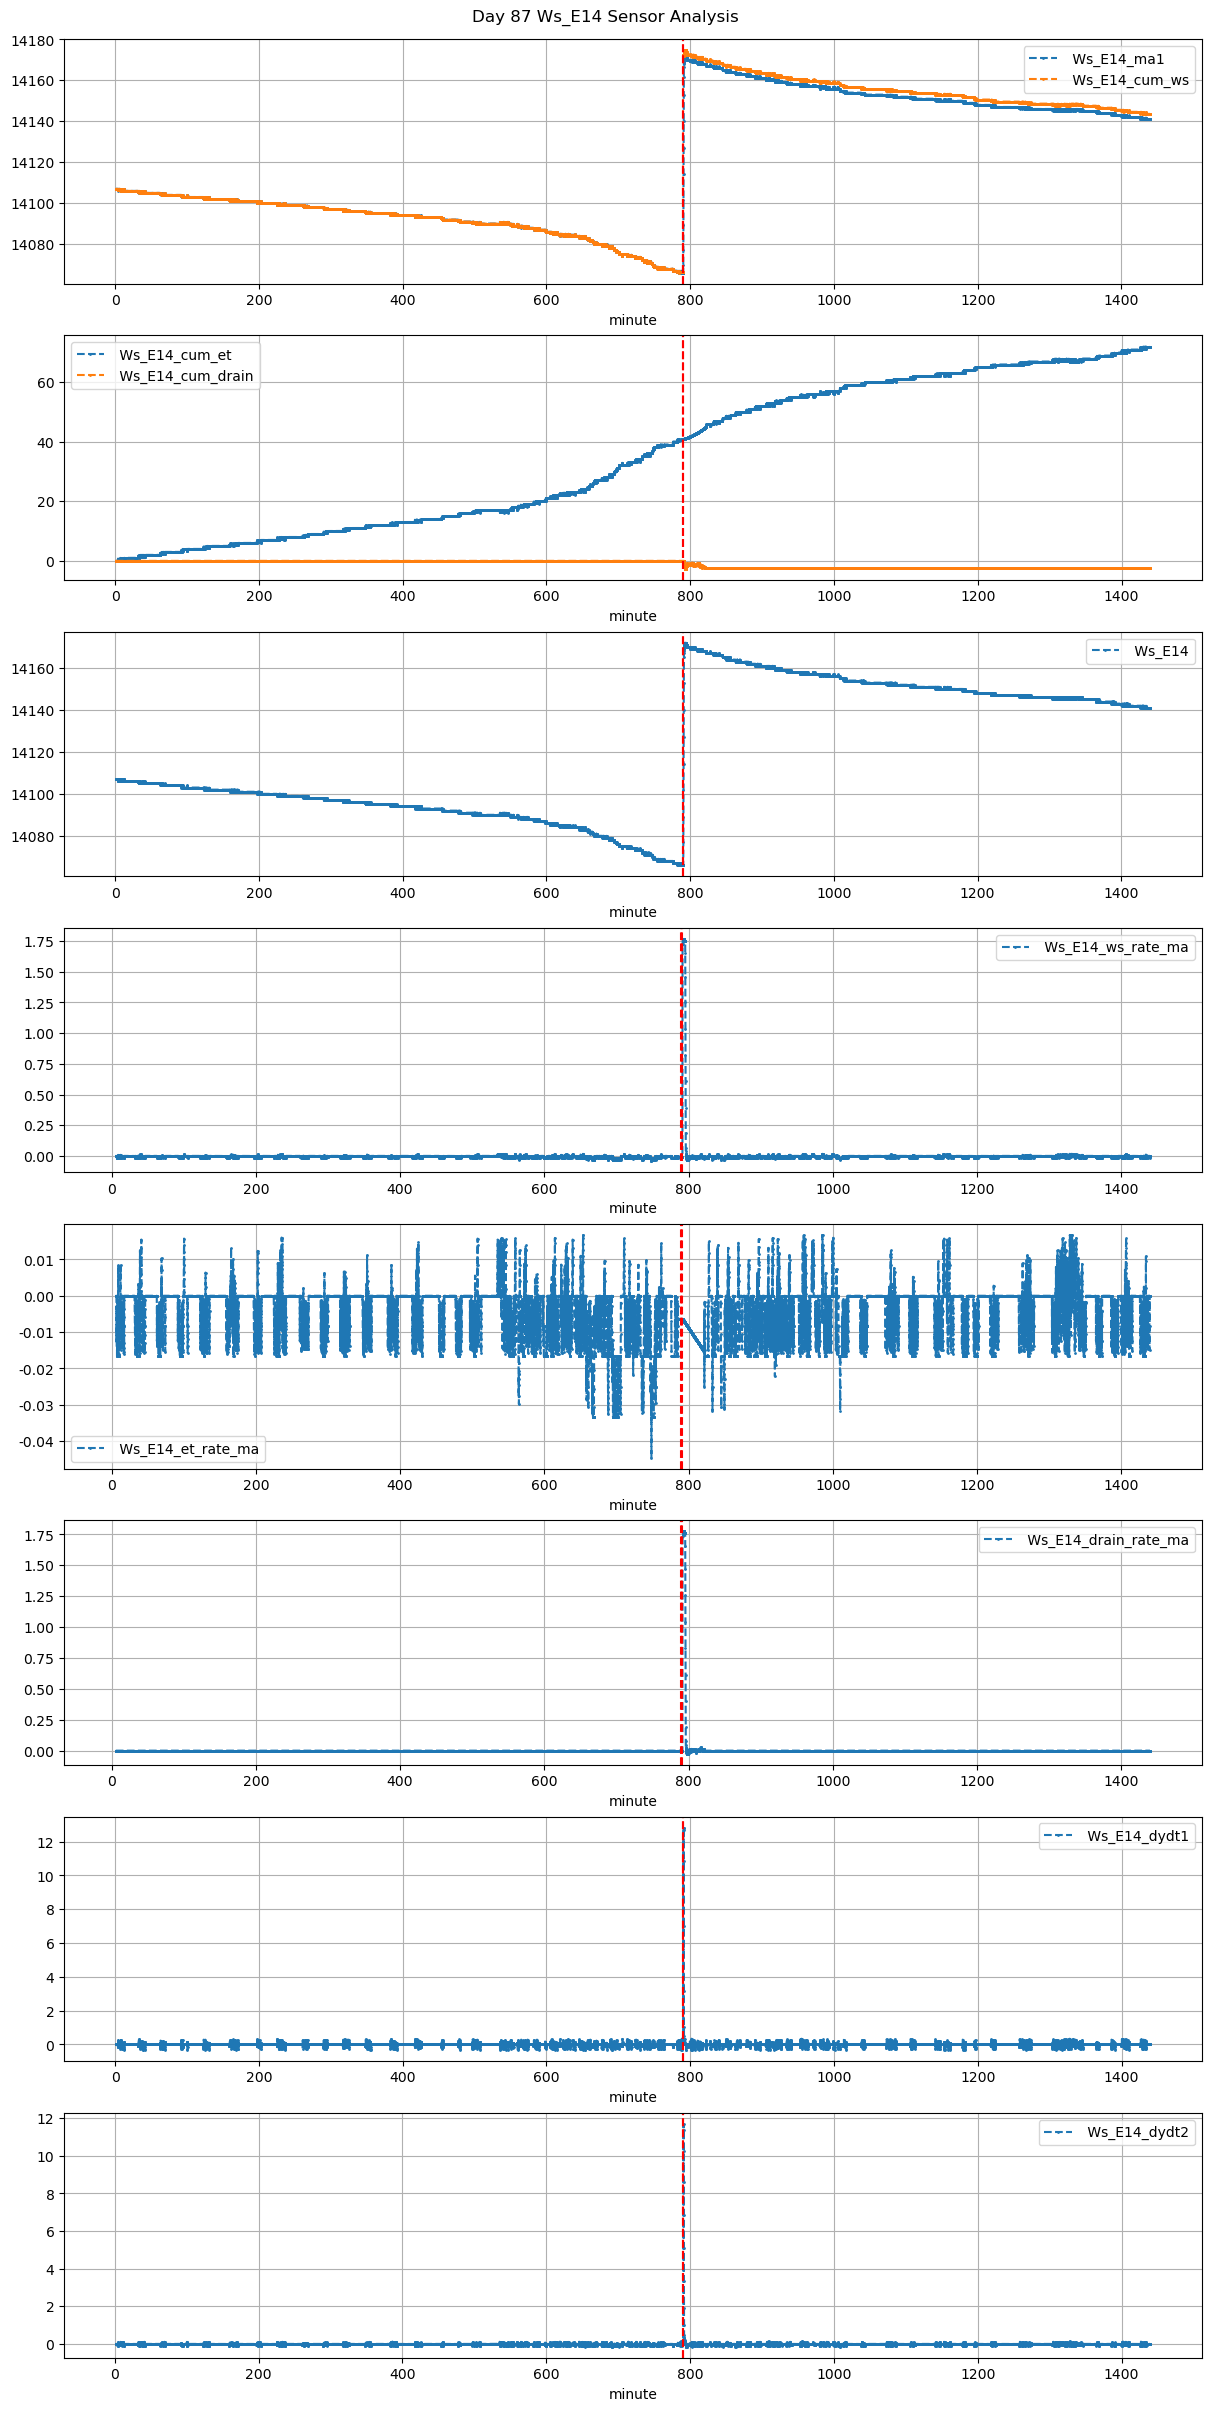
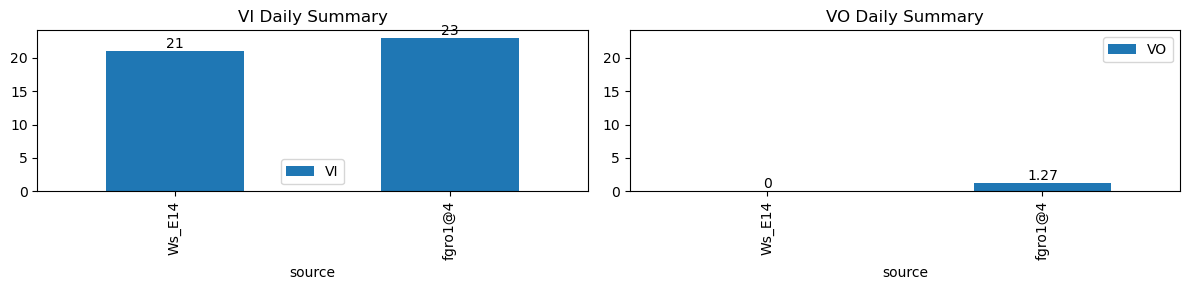
VI and VO Daily Summary
| ws_name | total_dp | nan_dp | nan_filled_dp | long_gap_dp | num_spike |
|---|---|---|---|---|---|
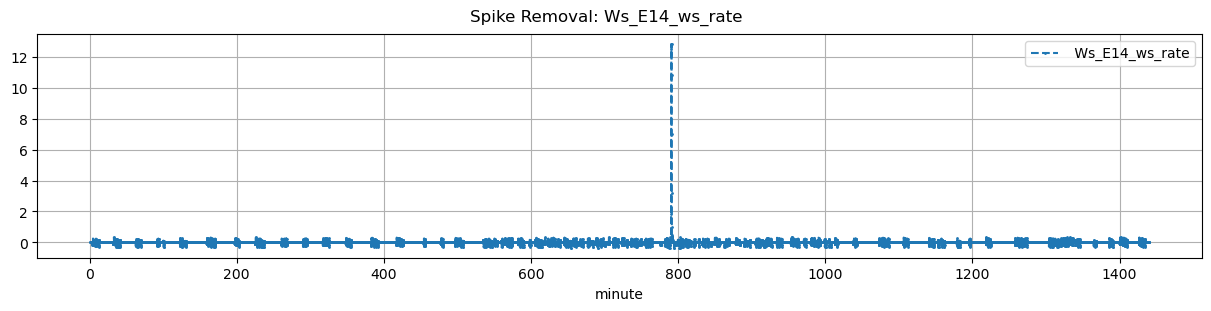
| Ws_E14 | 17268 | 0 | 14519 | 0 | 0 |
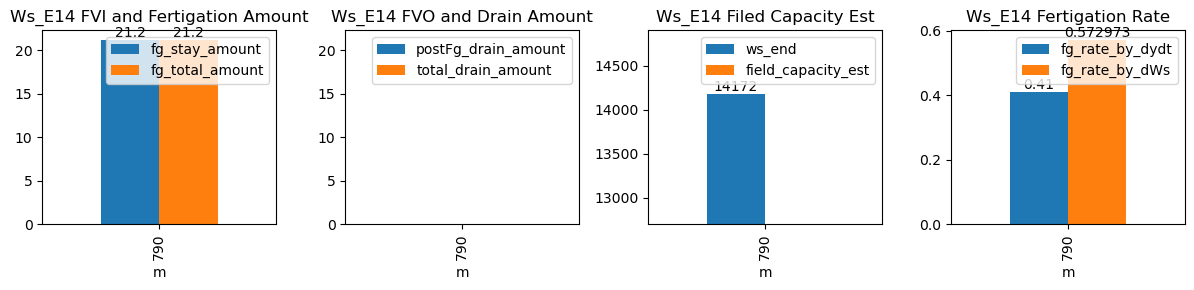
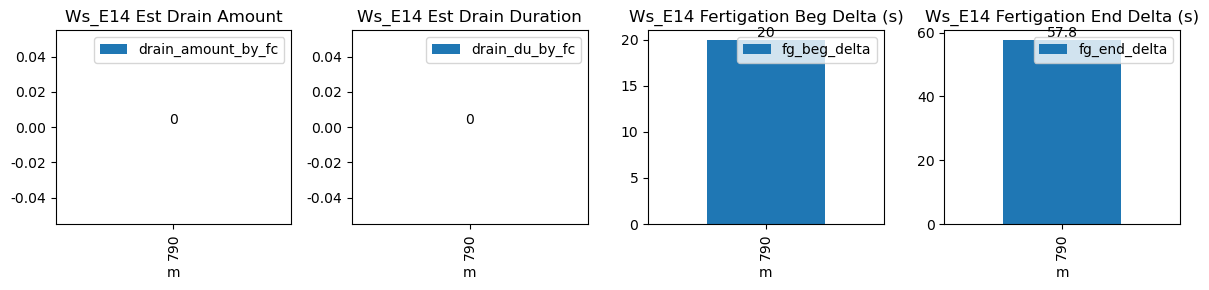
| ds | d | m | ws_name | prominence_cut | max_drain_du | fg_beg | fg_beg_est | fg_end | fg_end_est | drain_amount_by_fc | drain_du_by_fc | drain_rate_by_fc | ws_beg | ws_end | duc | pre_fg_et | post_fg_ws | post_drn_et | fg_rate_by_dydt | fg_rate_by_dWs | fg_stay_amount | fg_beg_delta | fg_end_delta | fg_total_amount | fg_drain_amount | postFg_drain_amount | field_capacity_est | total_drain_amount |
|---|---|---|---|---|---|---|---|---|---|---|---|---|---|---|---|---|---|---|---|---|---|---|---|---|---|---|---|---|
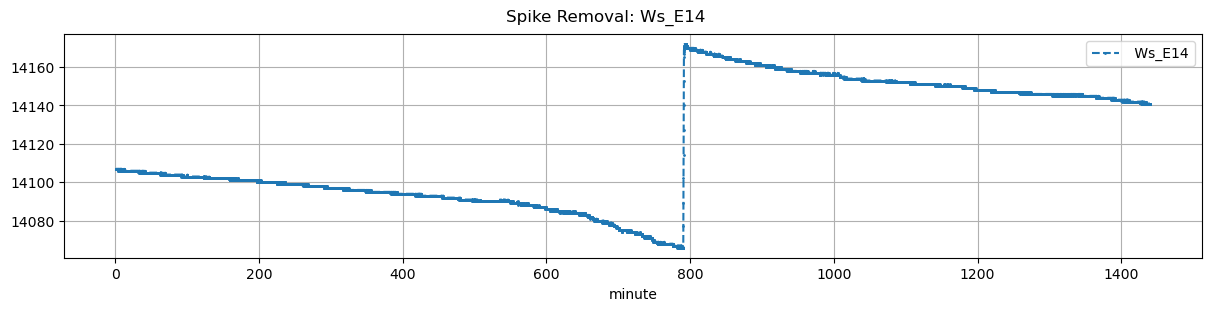
| 2026-01-01 13:10:00+08:00 | 87 | 790 | Ws_E14 | 0.13867 | 30 | 790.0 | 790.333333 | 790.62 | 791.583333 | NaN | NaN | NaN | 14066.0 | 14172.0 | 37 | -0.006356 | -0.020556 | -0.015361 | 0.41 | 0.572973 | 21.2 | 20.0 | 57.8 | 21.2 | 0.0 | -0.451366 | NaN | -0.451366 |