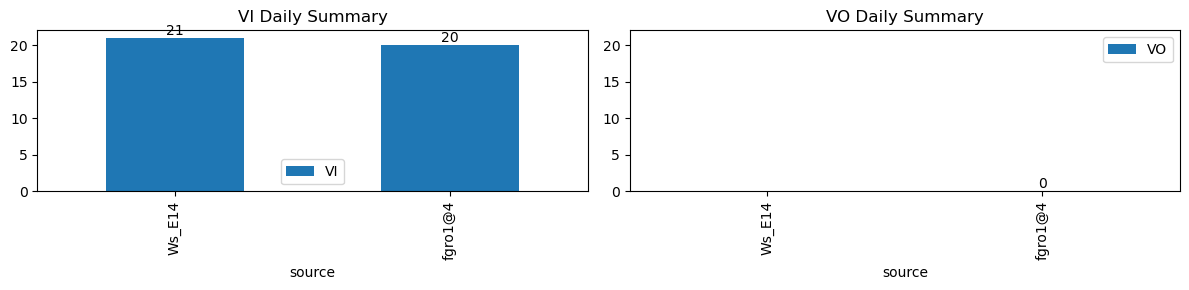
VI and VO Daily Summary
| ws_name | total_dp | nan_dp | nan_filled_dp | long_gap_dp | num_spike |
|---|---|---|---|---|---|
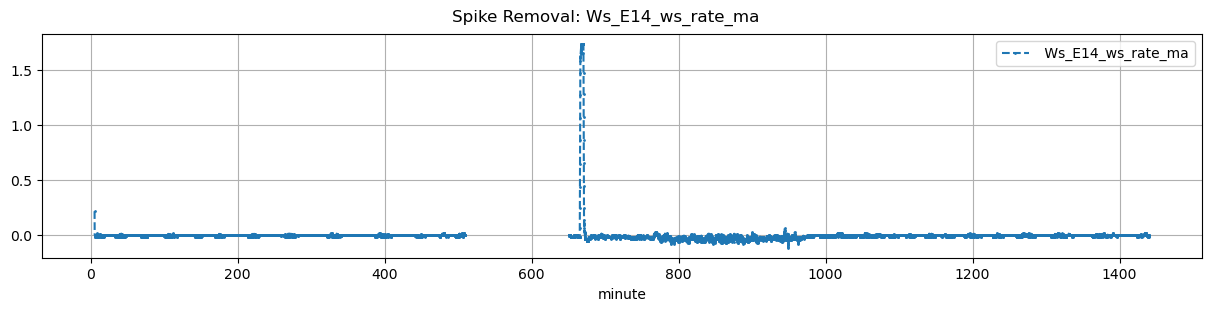
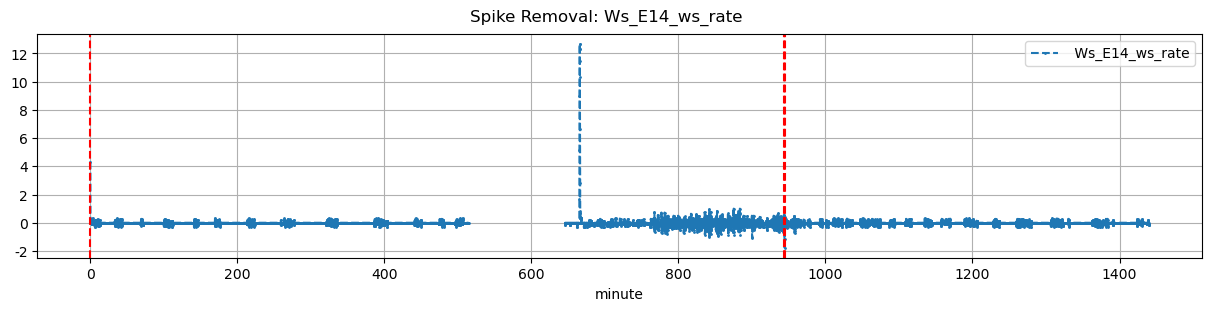
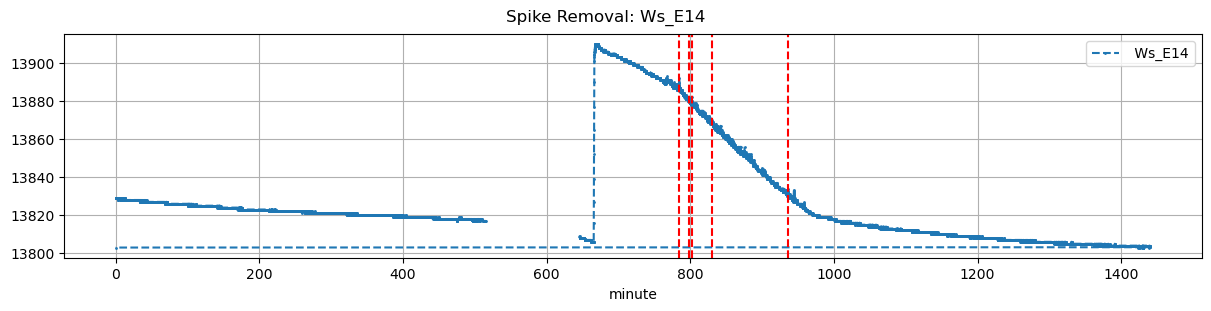
| Ws_E14 | 17279 | 1599 | 12849 | 1599 | 5 |
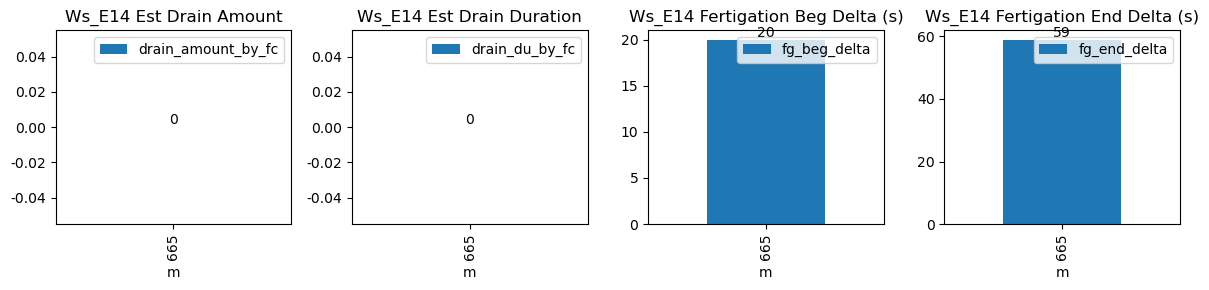
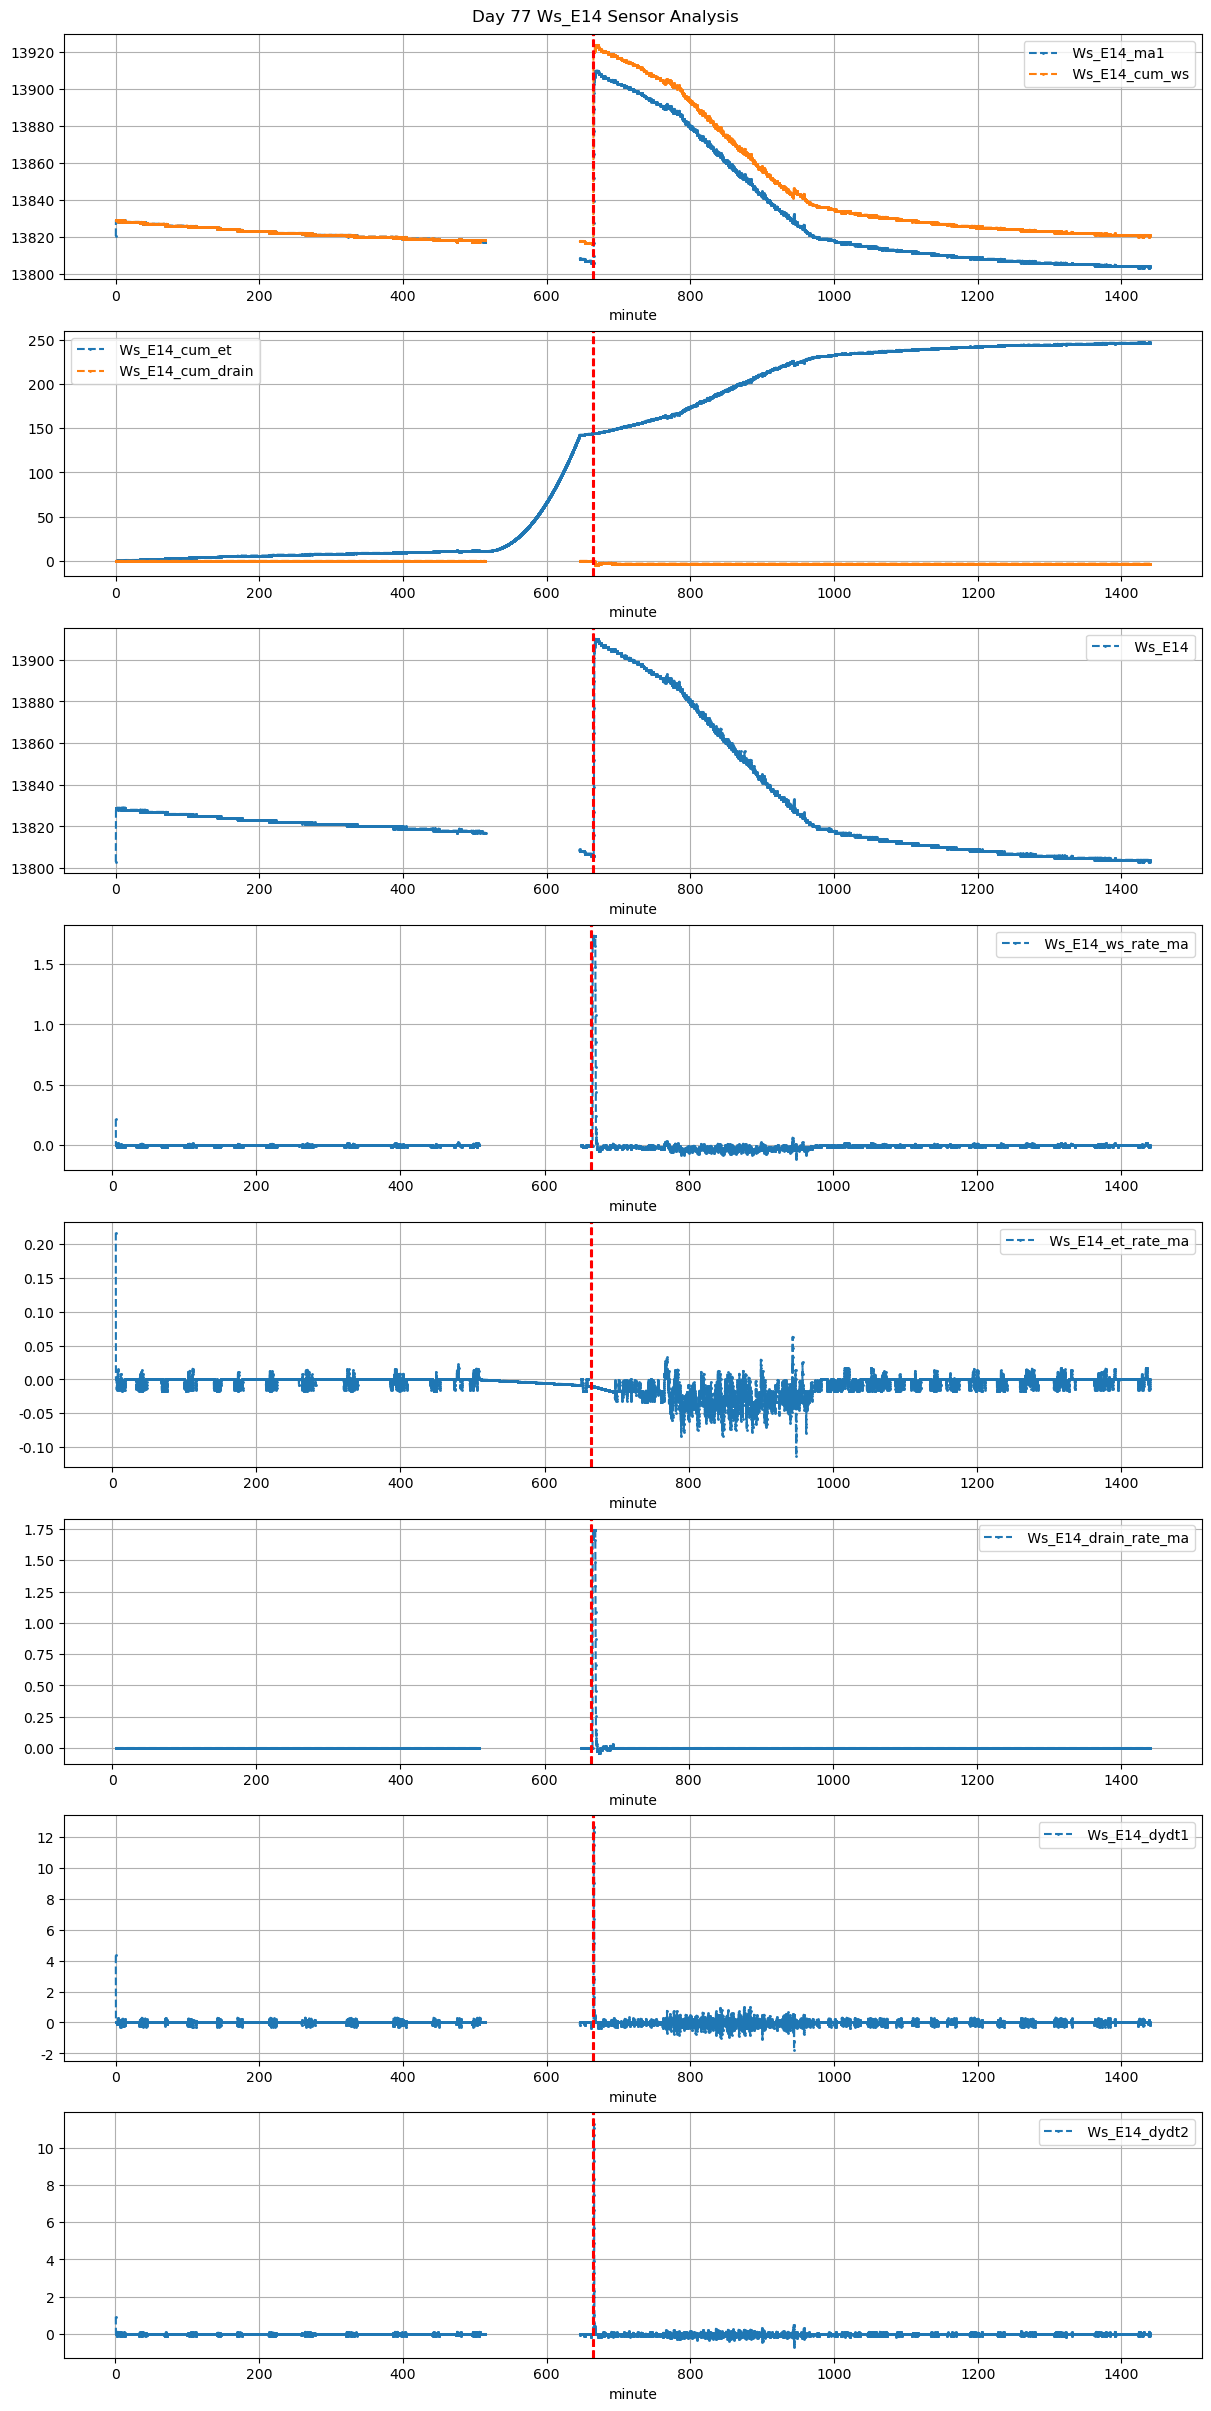
| ds | d | m | ws_name | prominence_cut | max_drain_du | fg_beg | fg_beg_est | fg_end | fg_end_est | drain_amount_by_fc | drain_du_by_fc | drain_rate_by_fc | ws_beg | ws_end | duc | pre_fg_et | post_fg_ws | post_drn_et | fg_rate_by_dydt | fg_rate_by_dWs | fg_stay_amount | fg_beg_delta | fg_end_delta | fg_total_amount | fg_drain_amount | postFg_drain_amount | field_capacity_est | total_drain_amount |
|---|---|---|---|---|---|---|---|---|---|---|---|---|---|---|---|---|---|---|---|---|---|---|---|---|---|---|---|---|
| 2025-12-22 11:05:00+08:00 | 77 | 665 | Ws_E14 | 0.204299 | 30 | 665.0 | 665.333333 | 665.6 | 666.583333 | NaN | NaN | NaN | 13806.0 | 13910.0 | 36 | -0.010028 | -0.027361 | -0.018472 | 0.397143 | 0.577778 | 20.8 | 20.0 | 59.0 | 20.8 | 0.0 | -0.58933 | NaN | -0.58933 |