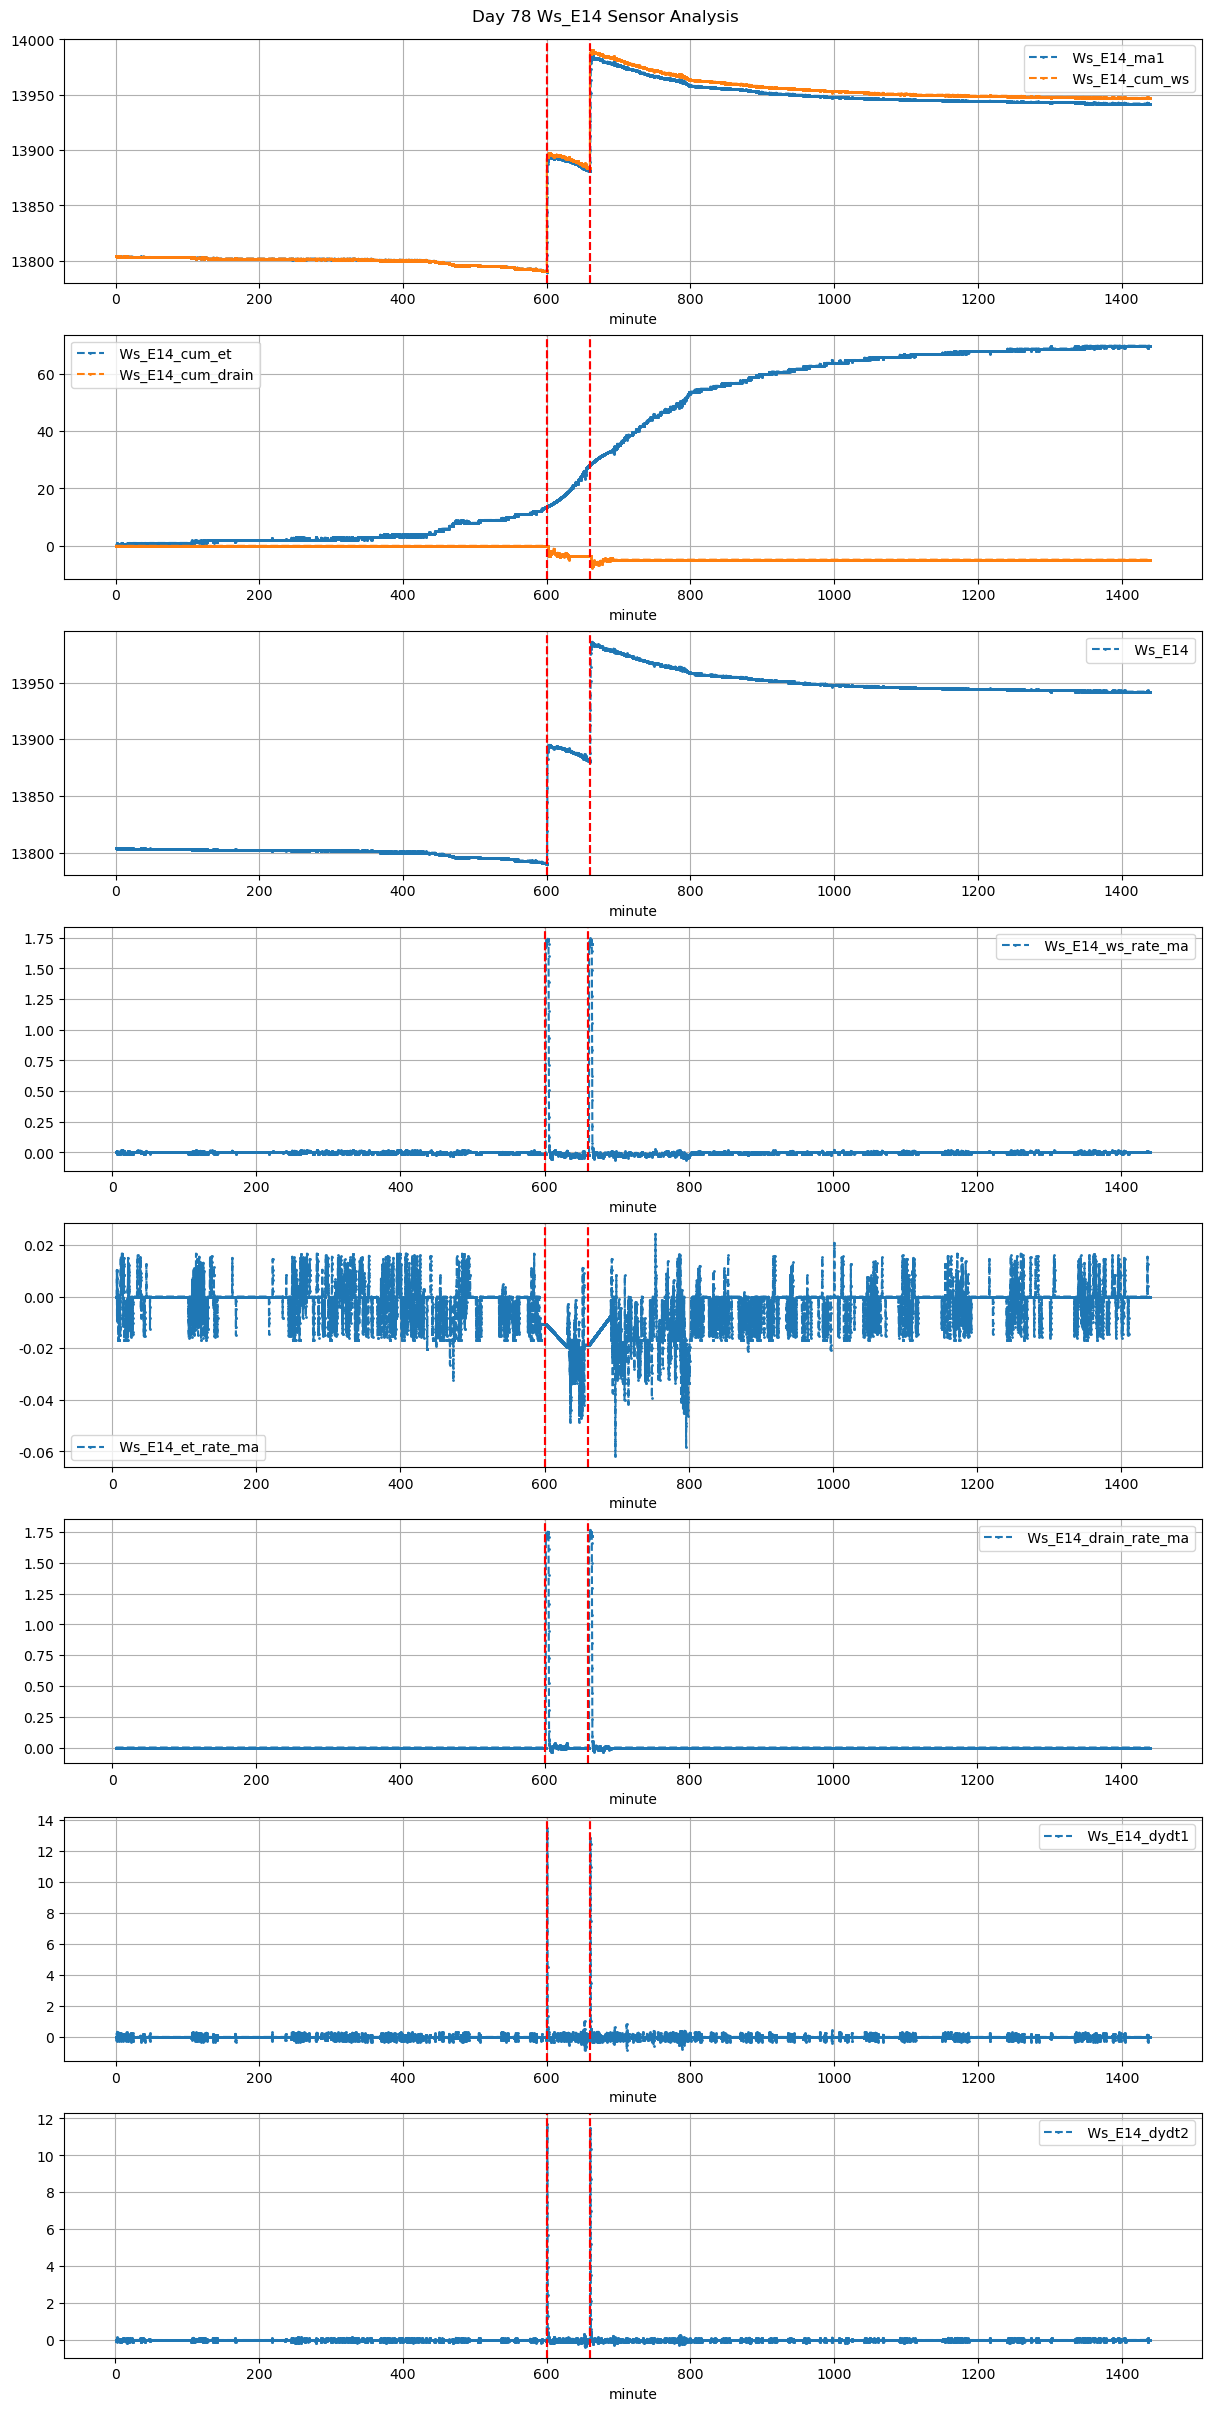
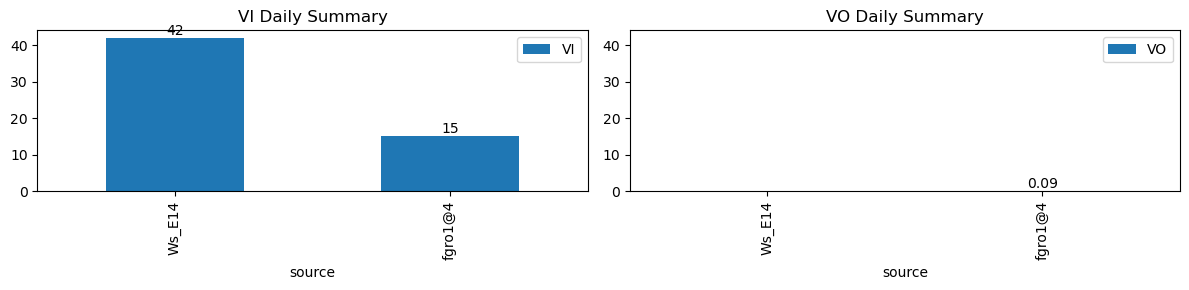
VI and VO Daily Summary
| ws_name | total_dp | nan_dp | nan_filled_dp | long_gap_dp | num_spike |
|---|---|---|---|---|---|
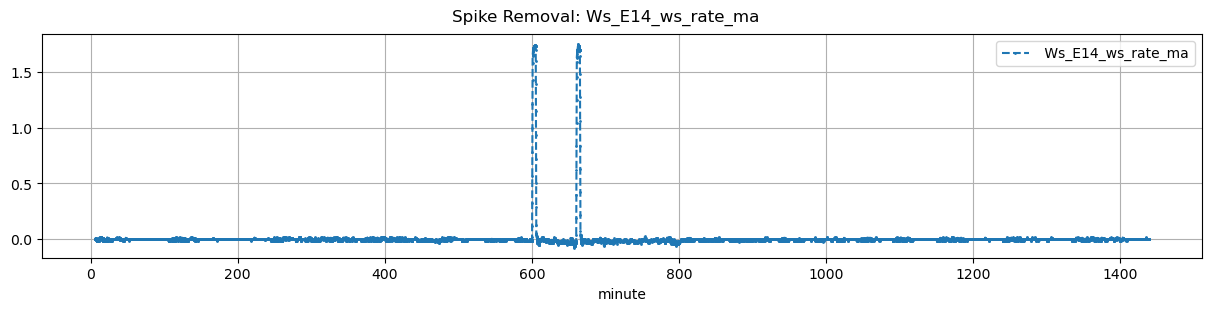
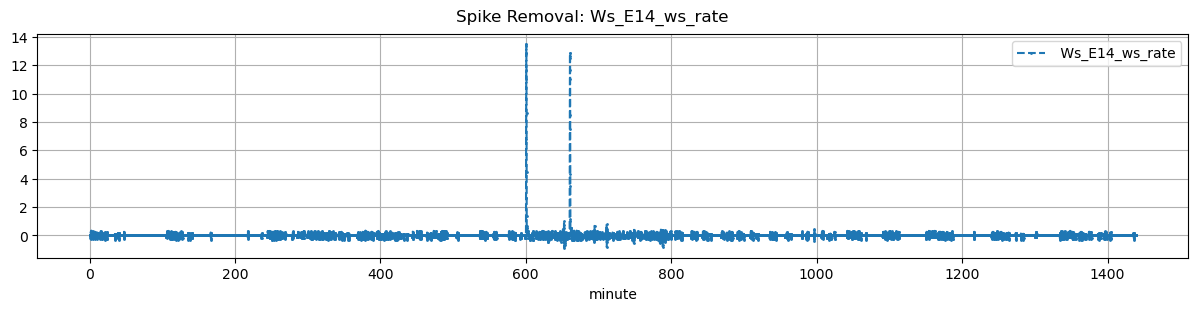
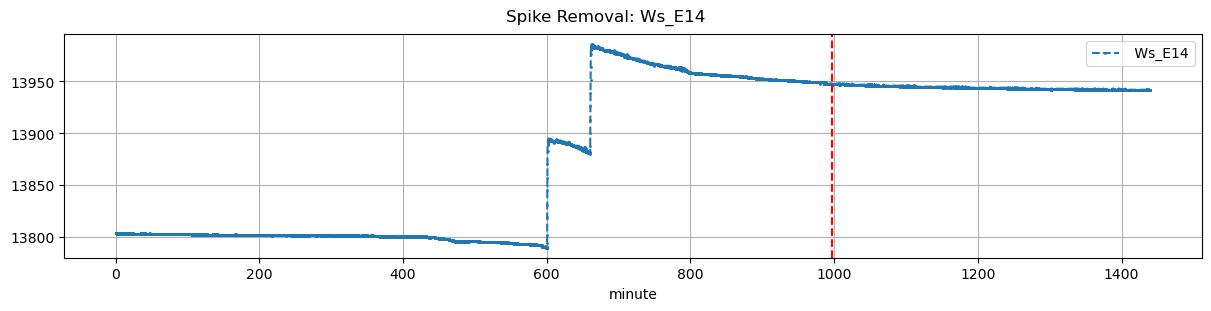
| Ws_E14 | 17273 | 0 | 14346 | 0 | 1 |
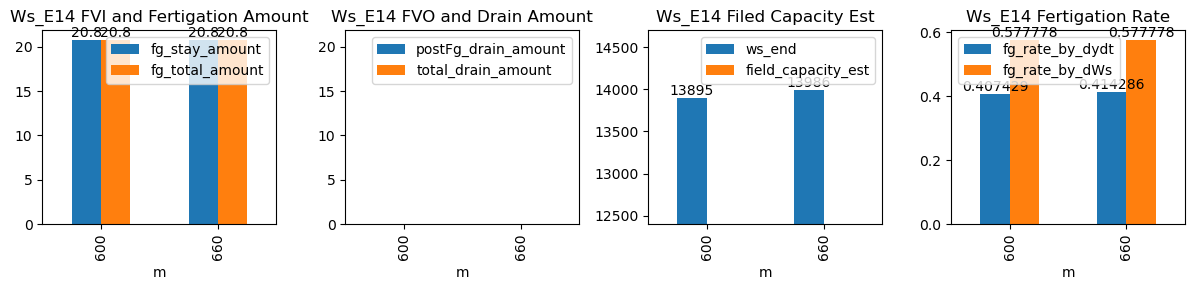
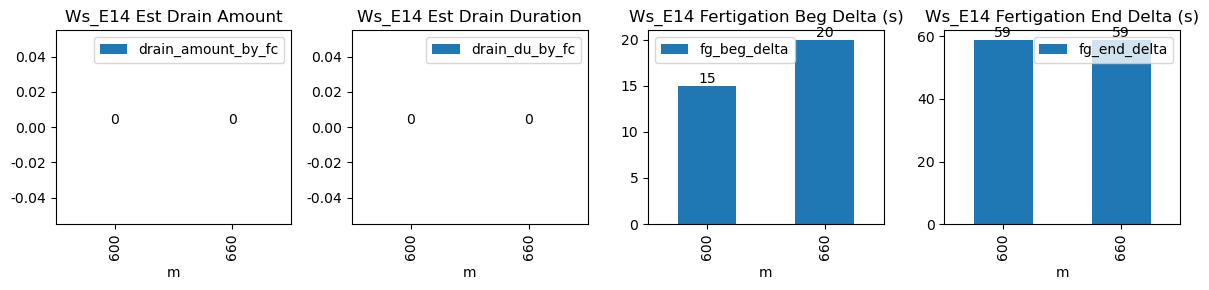
| ds | d | m | ws_name | prominence_cut | max_drain_du | fg_beg | fg_beg_est | fg_end | fg_end_est | drain_amount_by_fc | drain_du_by_fc | drain_rate_by_fc | ws_beg | ws_end | duc | pre_fg_et | post_fg_ws | post_drn_et | fg_rate_by_dydt | fg_rate_by_dWs | fg_stay_amount | fg_beg_delta | fg_end_delta | fg_total_amount | fg_drain_amount | postFg_drain_amount | field_capacity_est | total_drain_amount |
|---|---|---|---|---|---|---|---|---|---|---|---|---|---|---|---|---|---|---|---|---|---|---|---|---|---|---|---|---|
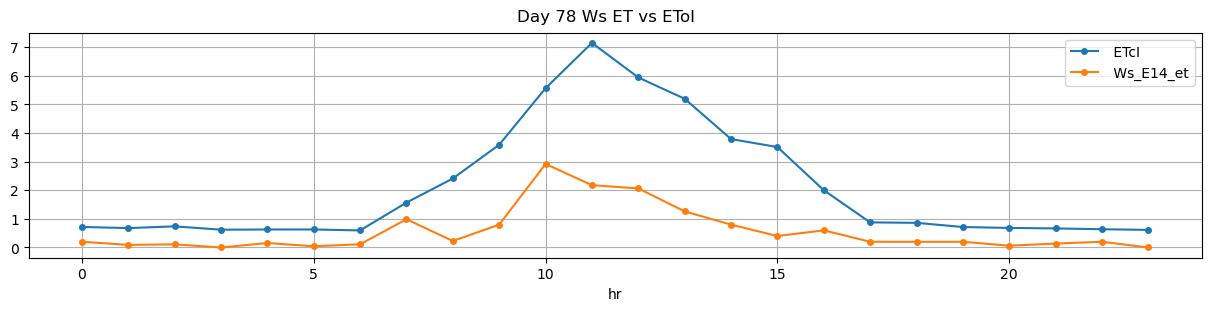
| 2025-12-23 10:00:00+08:00 | 78 | 600 | Ws_E14 | 0.16827 | 30 | 600.0 | 600.250000 | 600.6 | 601.583333 | NaN | NaN | NaN | 13791.0 | 13895.0 | 36 | -0.010593 | -0.023750 | -0.019722 | 0.407429 | 0.577778 | 20.8 | 15.0 | 59.0 | 20.8 | 0.0 | -0.952190 | NaN | -0.952190 |
| 2025-12-23 11:00:00+08:00 | 78 | 660 | Ws_E14 | 0.16827 | 30 | 660.0 | 660.333333 | 660.6 | 661.583333 | NaN | NaN | NaN | 13882.0 | 13986.0 | 36 | -0.034446 | -0.018611 | -0.007361 | 0.414286 | 0.577778 | 20.8 | 20.0 | 59.0 | 20.8 | 0.0 | -0.119935 | NaN | -0.119935 |