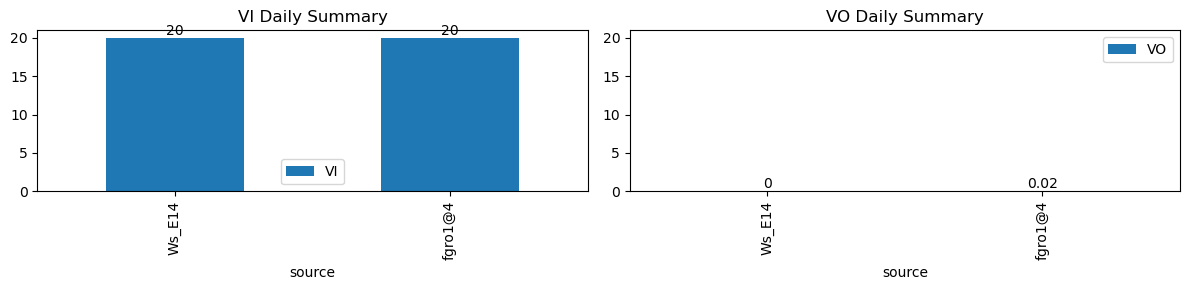
VI and VO Daily Summary
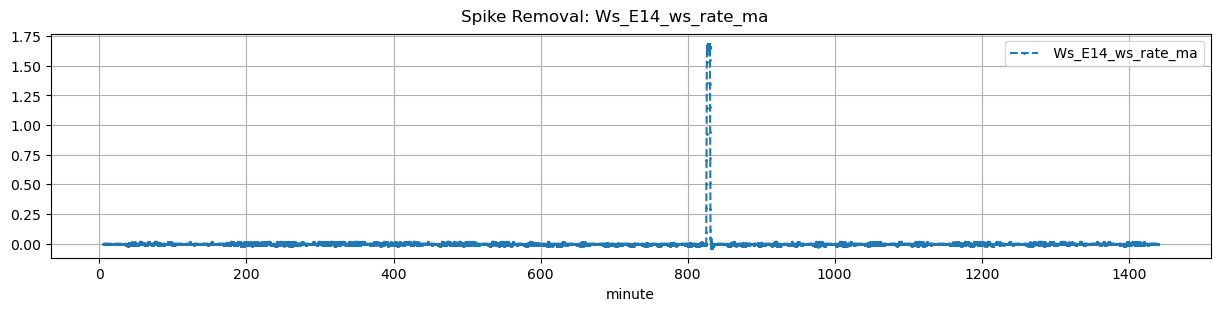
| ws_name | total_dp | nan_dp | nan_filled_dp | long_gap_dp | num_spike |
|---|---|---|---|---|---|
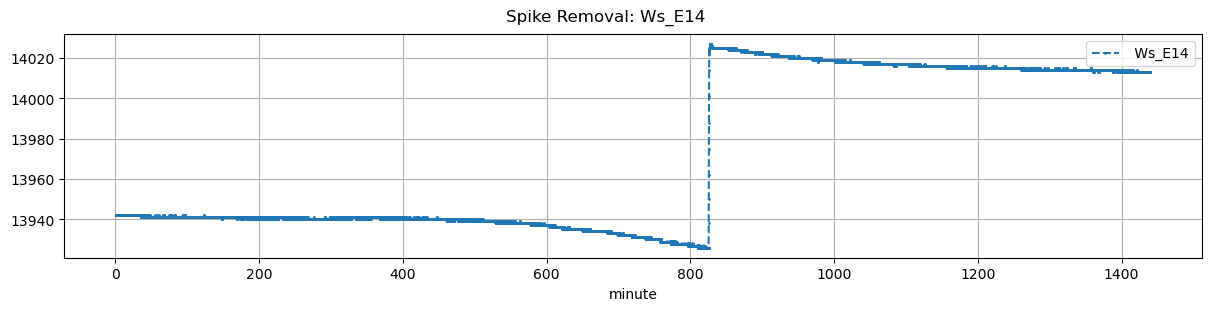
| Ws_E14 | 17269 | 0 | 14375 | 0 | 0 |
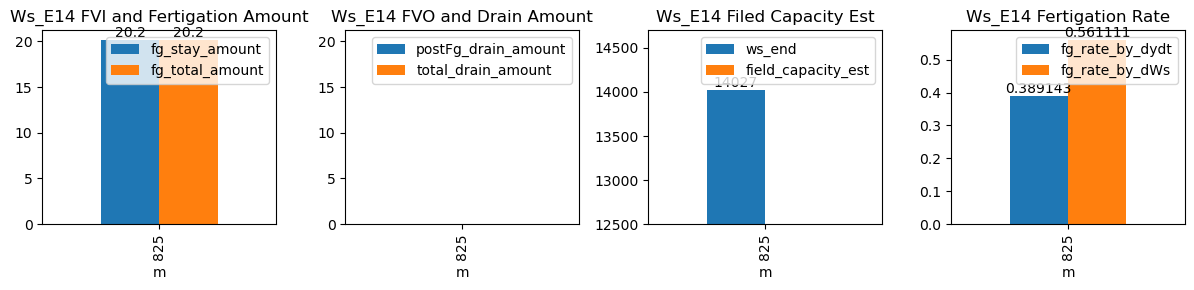
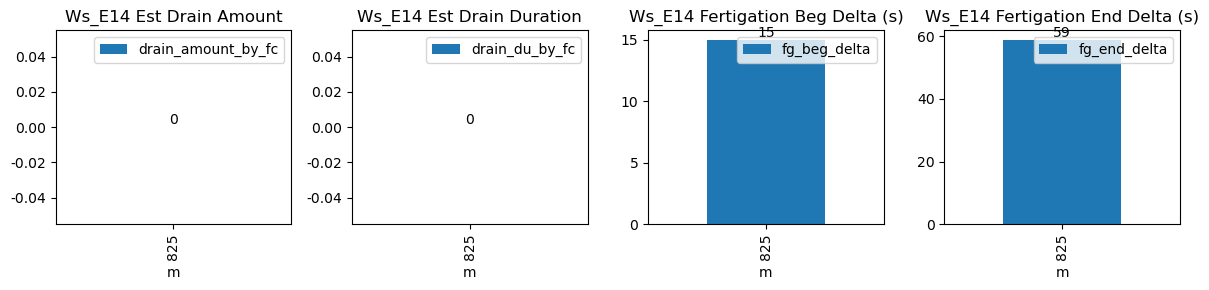
| ds | d | m | ws_name | prominence_cut | max_drain_du | fg_beg | fg_beg_est | fg_end | fg_end_est | drain_amount_by_fc | drain_du_by_fc | drain_rate_by_fc | ws_beg | ws_end | duc | pre_fg_et | post_fg_ws | post_drn_et | fg_rate_by_dydt | fg_rate_by_dWs | fg_stay_amount | fg_beg_delta | fg_end_delta | fg_total_amount | fg_drain_amount | postFg_drain_amount | field_capacity_est | total_drain_amount |
|---|---|---|---|---|---|---|---|---|---|---|---|---|---|---|---|---|---|---|---|---|---|---|---|---|---|---|---|---|
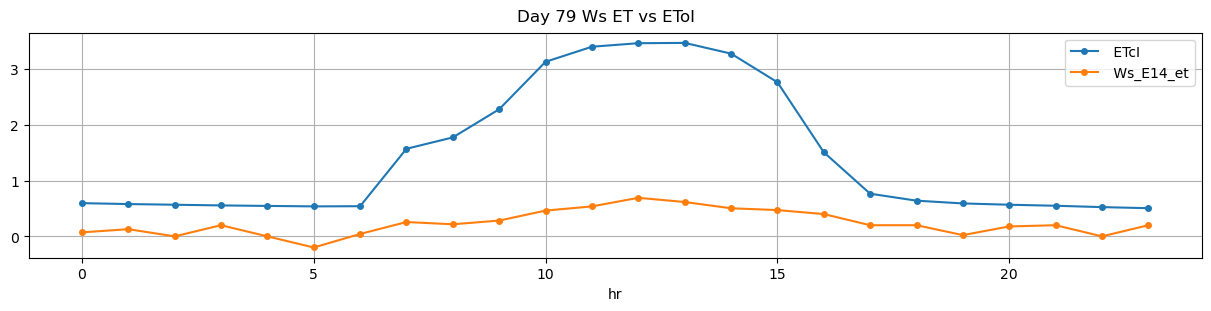
| 2025-12-24 13:45:00+08:00 | 79 | 825 | Ws_E14 | 0.143848 | 30 | 825.0 | 825.25 | 825.6 | 826.583333 | NaN | NaN | NaN | 13926.0 | 14027.0 | 36 | -0.001695 | -0.01625 | -0.005417 | 0.389143 | 0.561111 | 20.2 | 15.0 | 59.0 | 20.2 | 0.0 | -0.145297 | NaN | -0.145297 |