| 2026-01-02 09:05:00+08:00 |
88 |
545 |
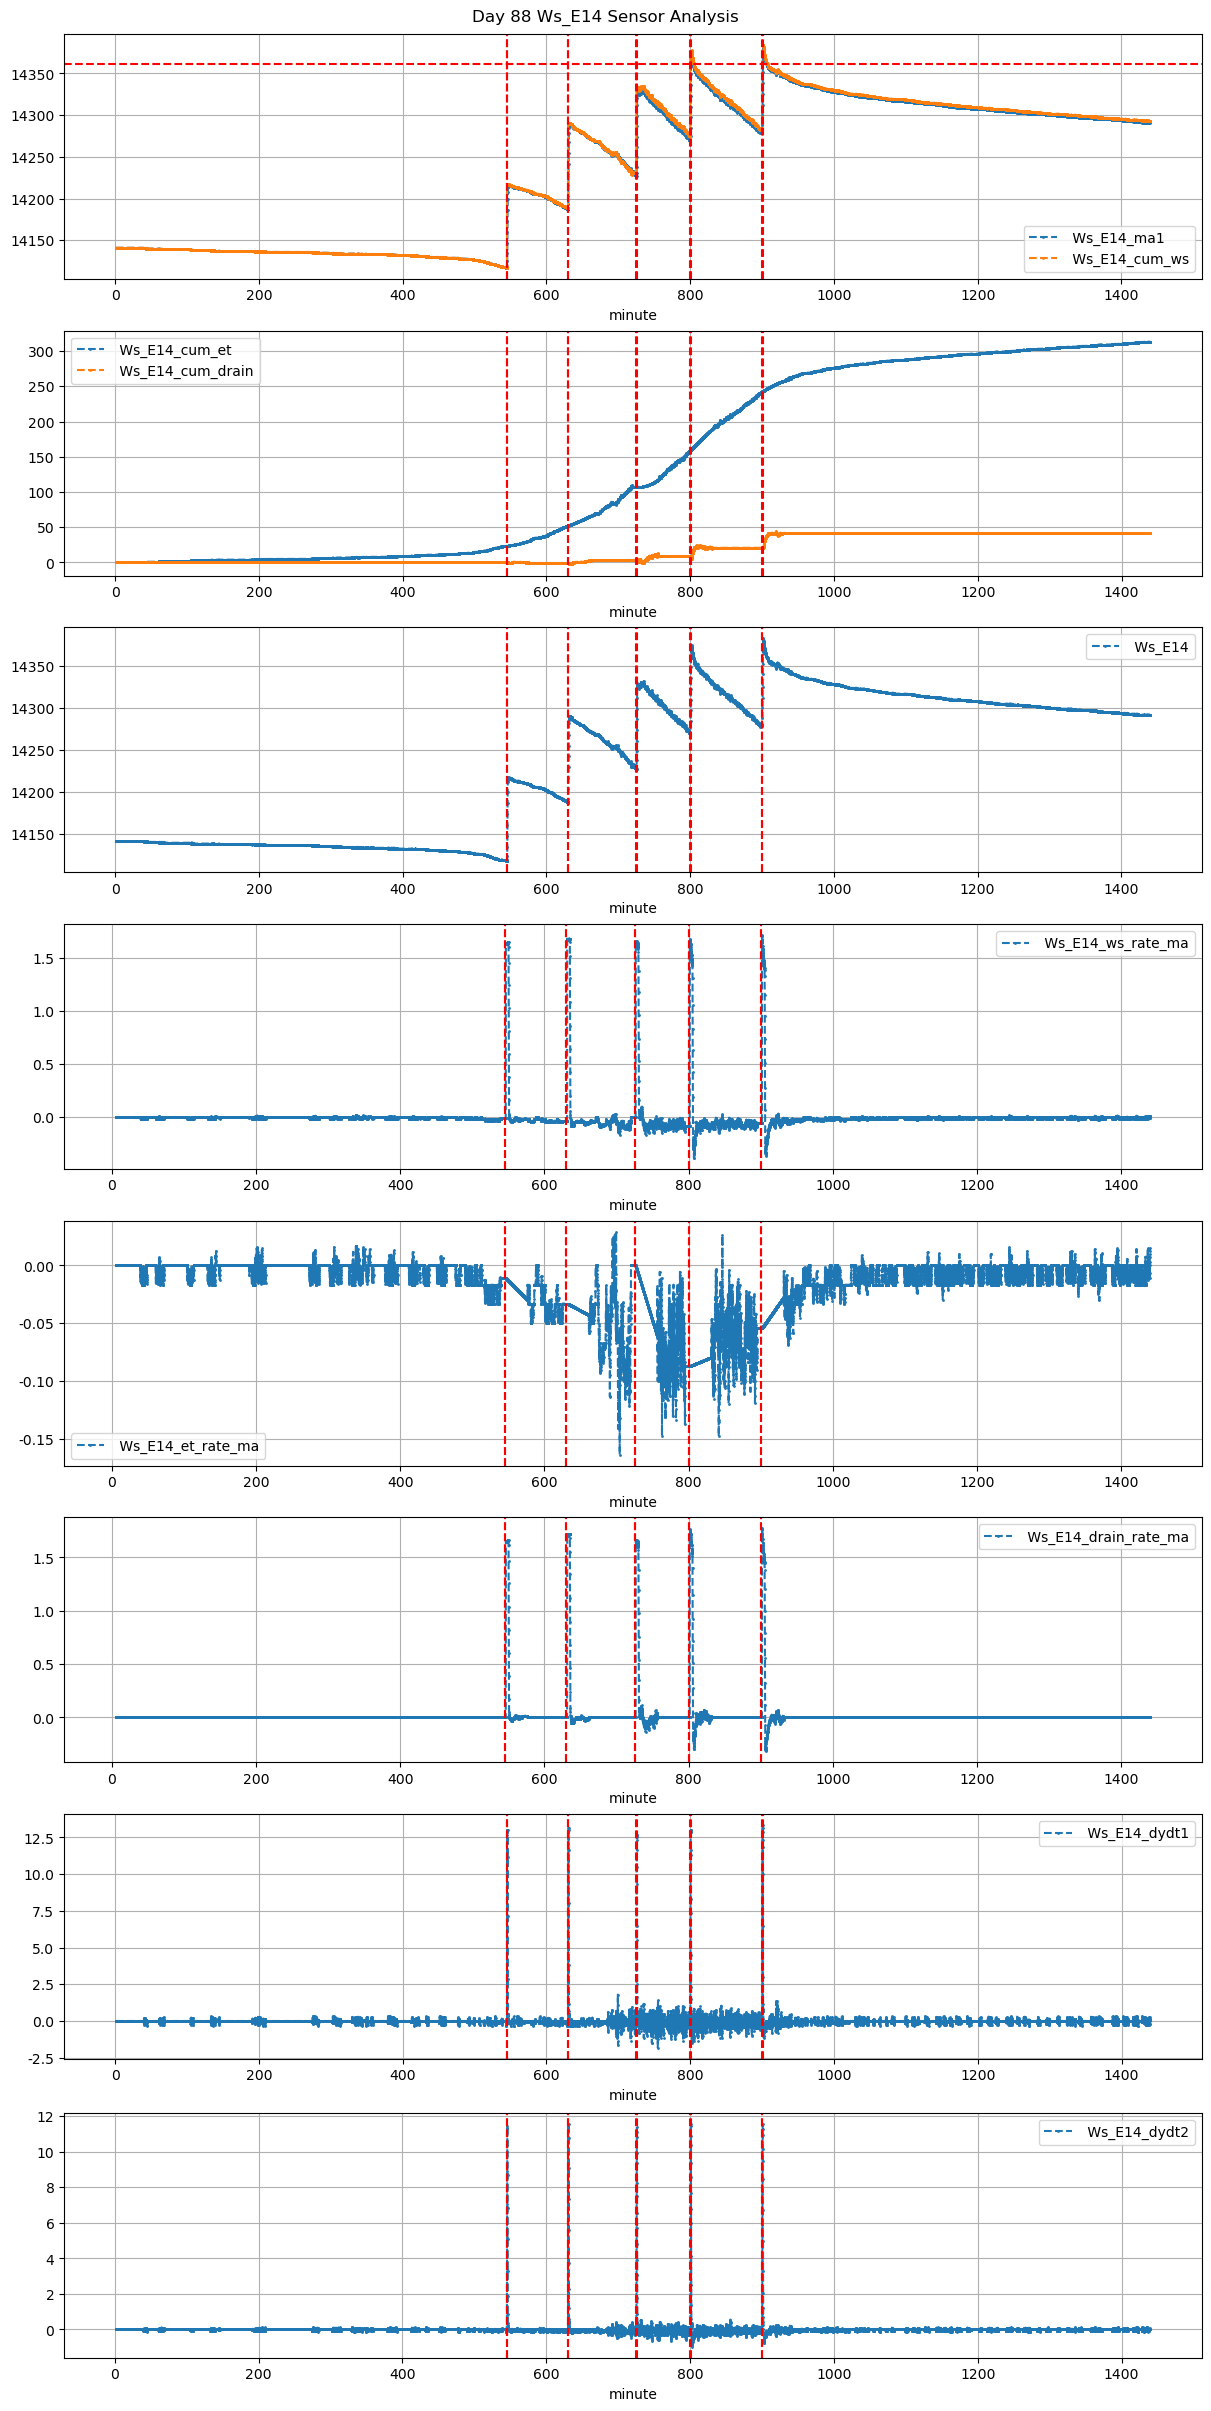
Ws_E14 |
0.356272 |
30 |
545.0 |
545.250000 |
545.6 |
546.500000 |
NaN |
NaN |
NaN |
14118.0 |
14217.0 |
36 |
-0.010876 |
-0.033056 |
-0.029722 |
0.414286 |
0.550000 |
19.8 |
15.0 |
54.0 |
19.8 |
0.0 |
-0.108495 |
NaN |
-0.108495 |
| 2026-01-02 10:30:00+08:00 |
88 |
630 |
Ws_E14 |
0.356272 |
30 |
630.0 |
630.250000 |
630.6 |
631.583333 |
NaN |
NaN |
NaN |
14189.0 |
14290.0 |
36 |
-0.032910 |
-0.072361 |
-0.042753 |
0.410000 |
0.561111 |
20.2 |
15.0 |
59.0 |
20.2 |
0.0 |
0.661368 |
NaN |
0.661368 |
| 2026-01-02 12:05:00+08:00 |
88 |
725 |
Ws_E14 |
0.356272 |
30 |
725.0 |
725.333333 |
725.6 |
726.583333 |
NaN |
NaN |
NaN |
14230.0 |
14331.0 |
36 |
-0.059440 |
0.000000 |
-0.061607 |
0.397143 |
0.561111 |
20.2 |
20.0 |
59.0 |
20.2 |
0.0 |
1.570147 |
NaN |
1.570147 |
| 2026-01-02 13:20:00+08:00 |
88 |
800 |
Ws_E14 |
0.356272 |
30 |
800.0 |
800.250000 |
800.6 |
801.583333 |
NaN |
NaN |
NaN |
14272.5 |
14375.0 |
36 |
-0.087147 |
-0.214306 |
-0.079306 |
0.407714 |
0.569444 |
20.5 |
15.0 |
59.0 |
20.5 |
0.0 |
2.166562 |
NaN |
2.166562 |
| 2026-01-02 15:00:00+08:00 |
88 |
900 |
Ws_E14 |
0.356272 |
30 |
900.0 |
900.333333 |
900.6 |
901.666667 |
NaN |
NaN |
NaN |
14280.0 |
14383.0 |
36 |
-0.054343 |
-0.205417 |
-0.027500 |
0.400571 |
0.572222 |
20.6 |
20.0 |
64.0 |
20.6 |
0.0 |
4.215126 |
14361.924372 |
4.215126 |