| 2026-01-03 10:35:00+08:00 |
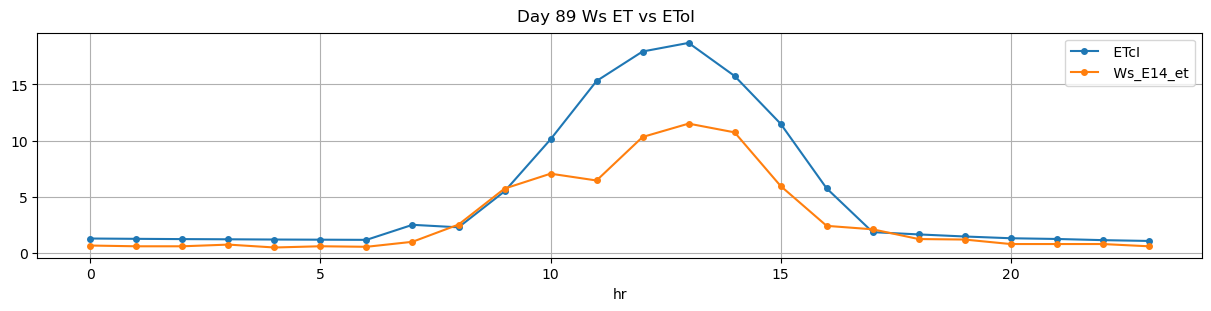
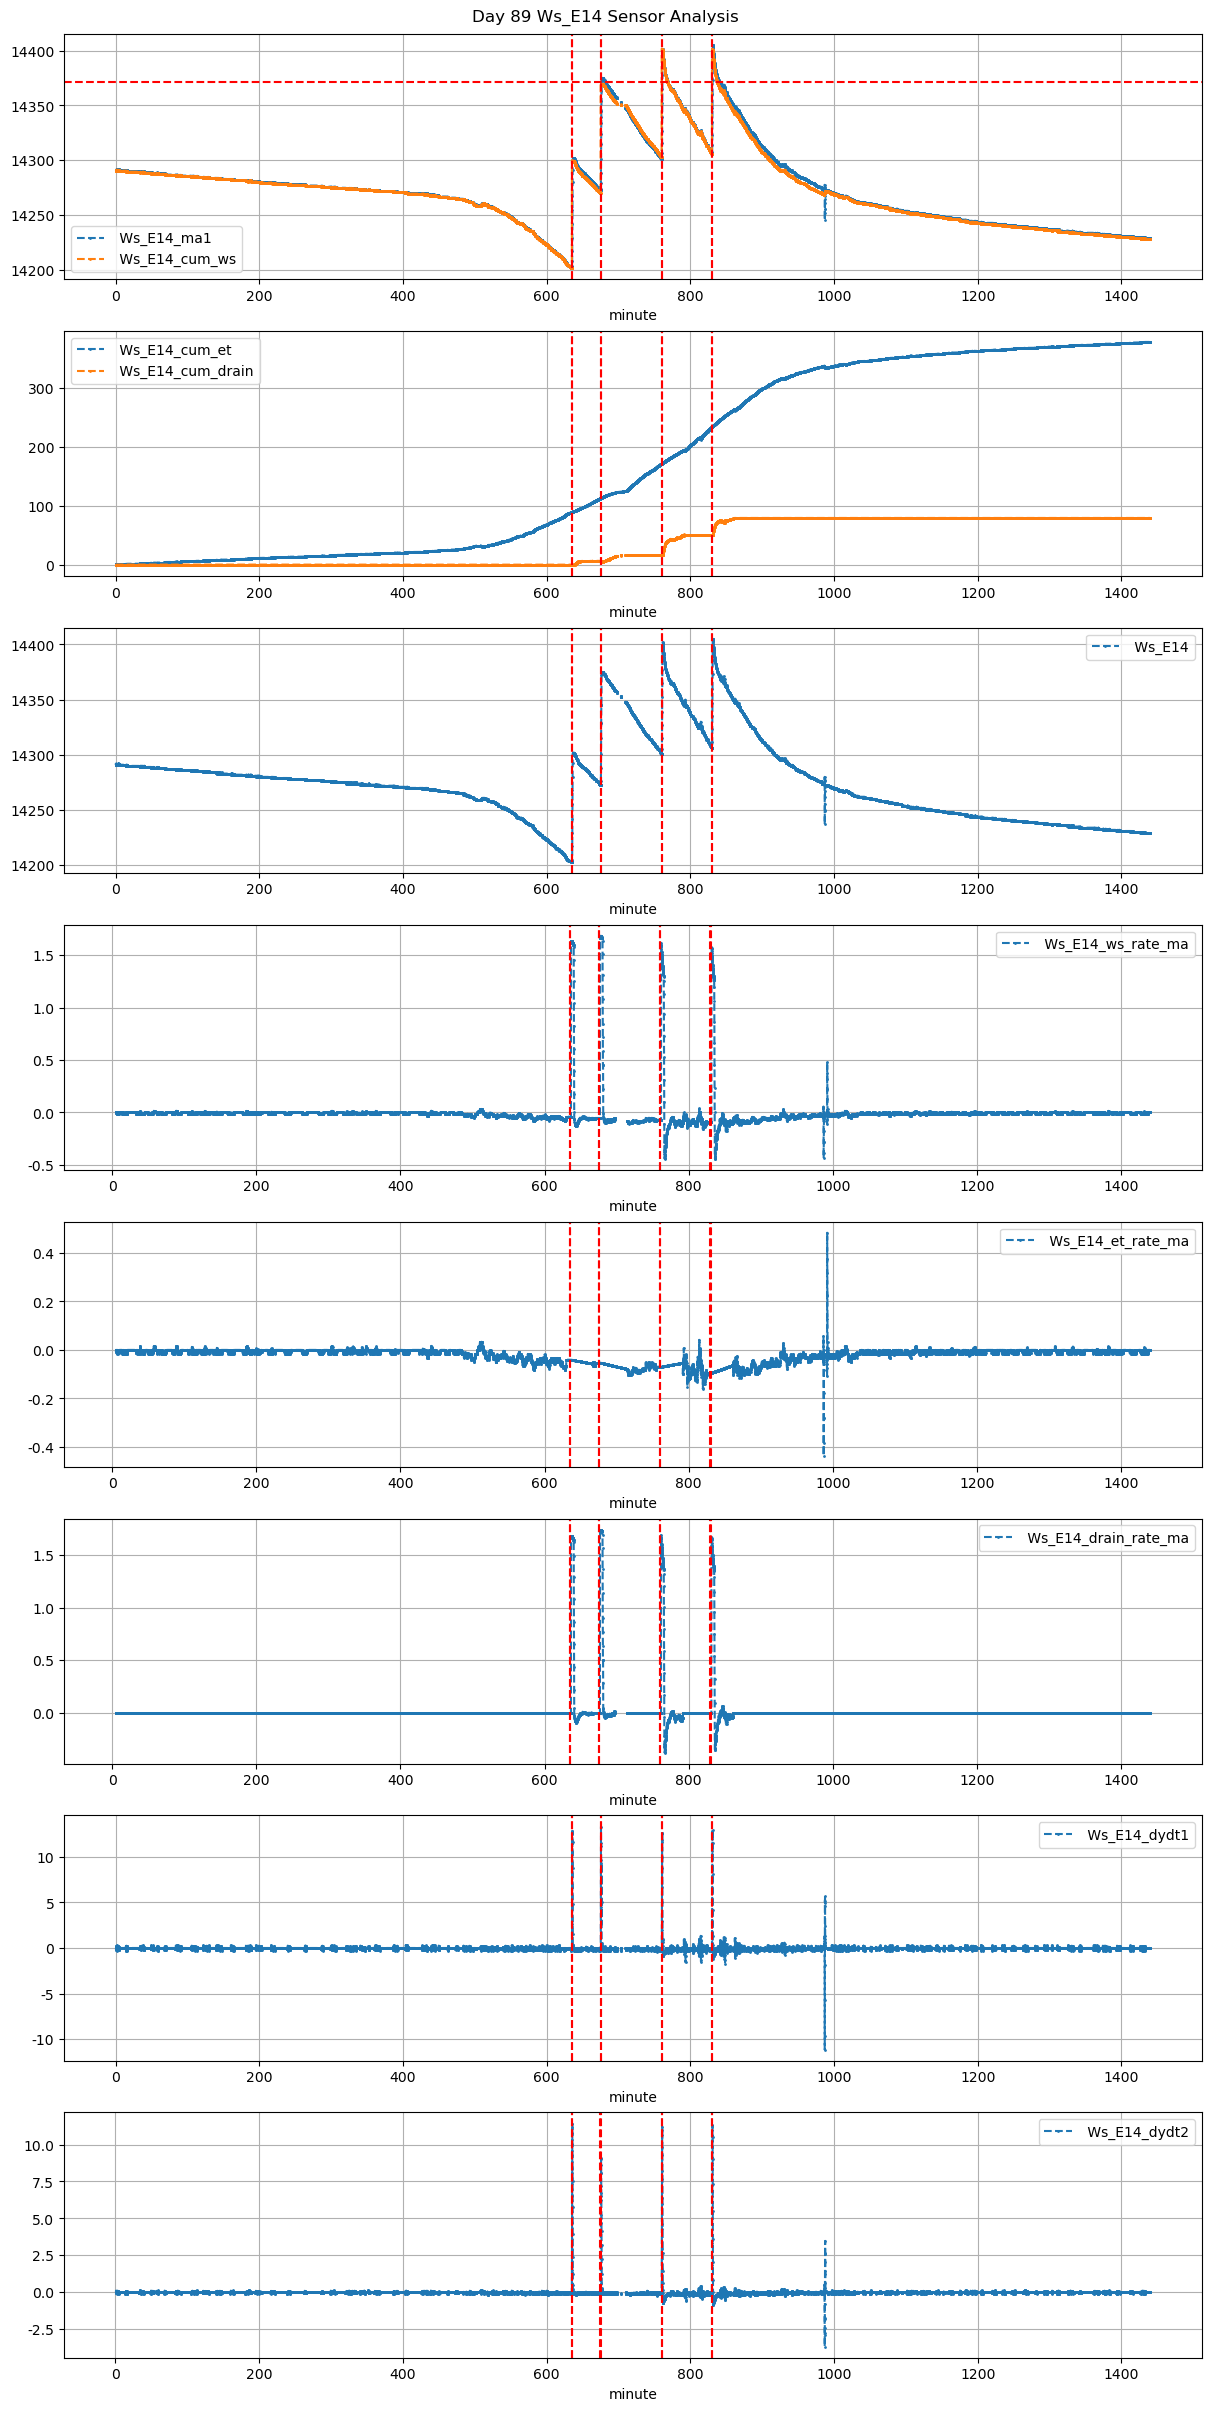
89 |
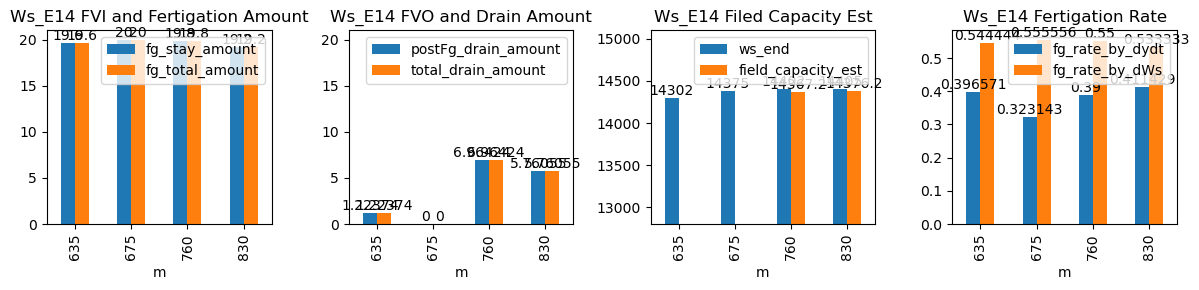
635 |
Ws_E14 |
0.408858 |
30 |
635.0 |
635.25 |
635.6 |
636.583333 |
NaN |
NaN |
NaN |
14204.0 |
14302.0 |
36 |
-0.040209 |
-0.111250 |
-0.056713 |
0.396571 |
0.544444 |
19.6 |
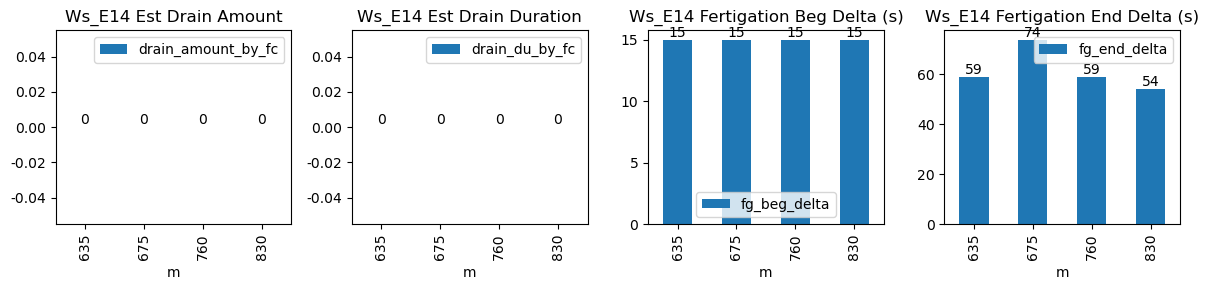
15.0 |
59.0 |
19.6 |
0.0 |
1.223738 |
NaN |
1.223738 |
| 2026-01-03 11:15:00+08:00 |
89 |
675 |
Ws_E14 |
0.408858 |
30 |
675.0 |
675.25 |
675.6 |
676.833333 |
NaN |
NaN |
NaN |
14275.0 |
14375.0 |
36 |
-0.052401 |
-0.083889 |
NaN |
0.323143 |
0.555556 |
20.0 |
15.0 |
74.0 |
20.0 |
0.0 |
NaN |
NaN |
NaN |
| 2026-01-03 12:40:00+08:00 |
89 |
760 |
Ws_E14 |
0.408858 |
30 |
760.0 |
760.25 |
760.6 |
761.583333 |
NaN |
NaN |
NaN |
14303.0 |
14402.0 |
36 |
-0.069572 |
-0.249861 |
-0.053056 |
0.390000 |
0.550000 |
19.8 |
15.0 |
59.0 |
19.8 |
0.0 |
6.964236 |
14367.178819 |
6.964236 |
| 2026-01-03 13:50:00+08:00 |
89 |
830 |
Ws_E14 |
0.408858 |
30 |
830.0 |
830.25 |
830.6 |
831.500000 |
NaN |
NaN |
NaN |
14309.0 |
14405.0 |
36 |
-0.094703 |
-0.252778 |
-0.062795 |
0.411429 |
0.533333 |
19.2 |
15.0 |
54.0 |
19.2 |
0.0 |
5.760546 |
14376.197268 |
5.760546 |