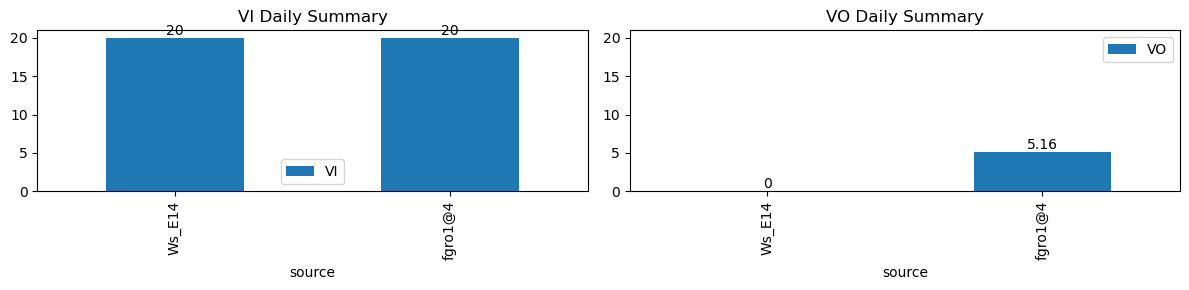
VI and VO Daily Summary
| ws_name | total_dp | nan_dp | nan_filled_dp | long_gap_dp | num_spike |
|---|---|---|---|---|---|
| Ws_E14 | 17269 | 0 | 14629 | 0 | 0 |
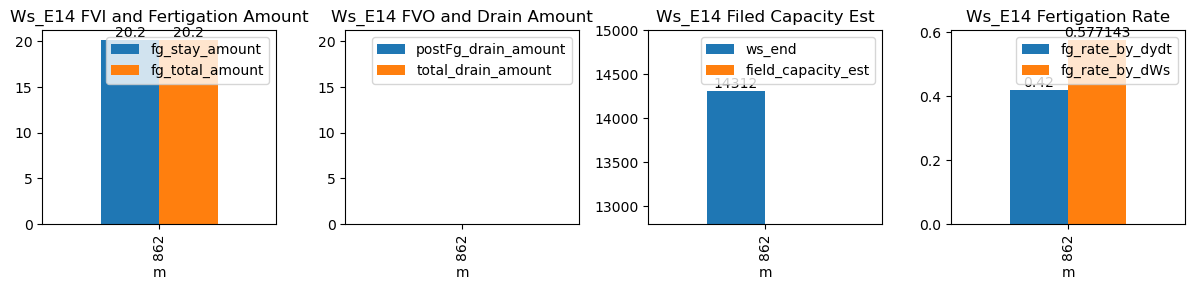
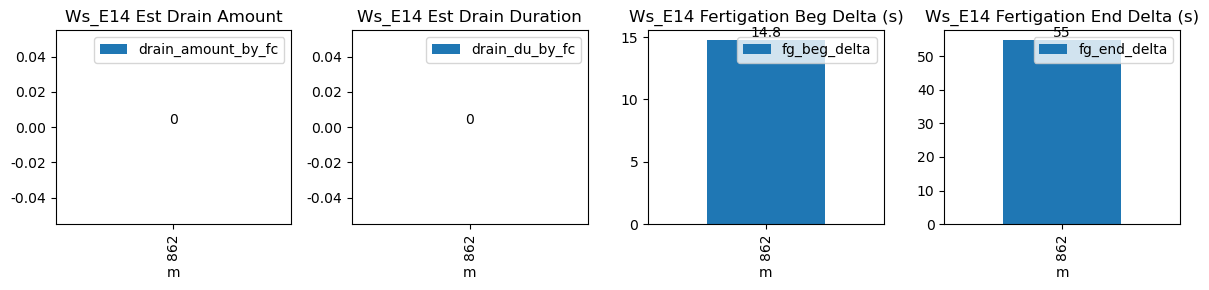
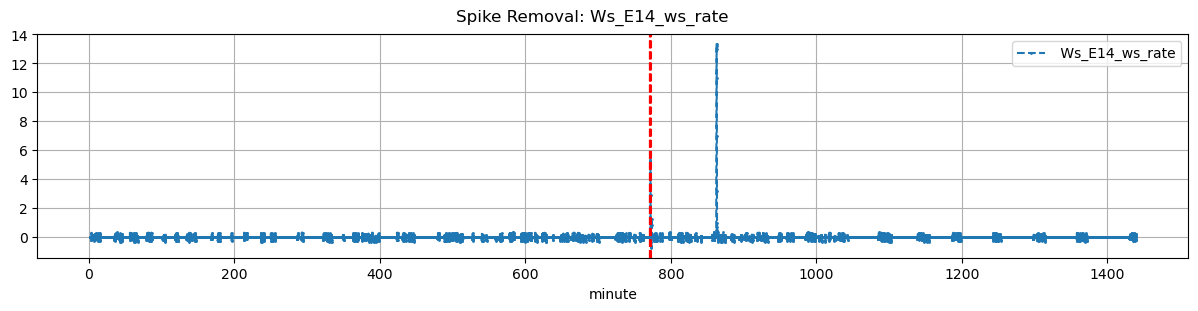
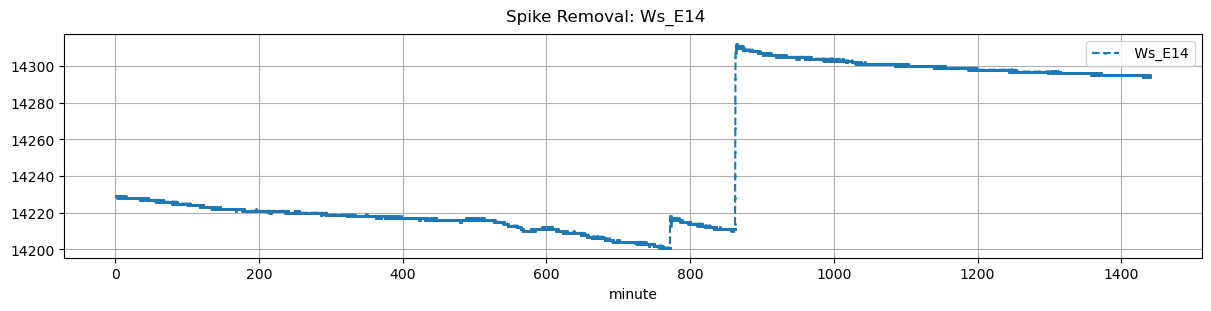
| ds | d | m | ws_name | prominence_cut | max_drain_du | fg_beg | fg_beg_est | fg_end | fg_end_est | drain_amount_by_fc | drain_du_by_fc | drain_rate_by_fc | ws_beg | ws_end | duc | pre_fg_et | post_fg_ws | post_drn_et | fg_rate_by_dydt | fg_rate_by_dWs | fg_stay_amount | fg_beg_delta | fg_end_delta | fg_total_amount | fg_drain_amount | postFg_drain_amount | field_capacity_est | total_drain_amount |
|---|---|---|---|---|---|---|---|---|---|---|---|---|---|---|---|---|---|---|---|---|---|---|---|---|---|---|---|---|
| 2026-01-04 14:22:10+08:00 | 90 | 862 | Ws_E14 | 0.139731 | 30 | 862.17 | 862.416667 | 862.75 | 863.666667 | NaN | NaN | NaN | 14211.0 | 14312.0 | 35 | -0.000833 | -0.011389 | -0.012639 | 0.42 | 0.577143 | 20.2 | 14.8 | 55.0 | 20.2 | 0.0 | -0.093415 | NaN | -0.093415 |