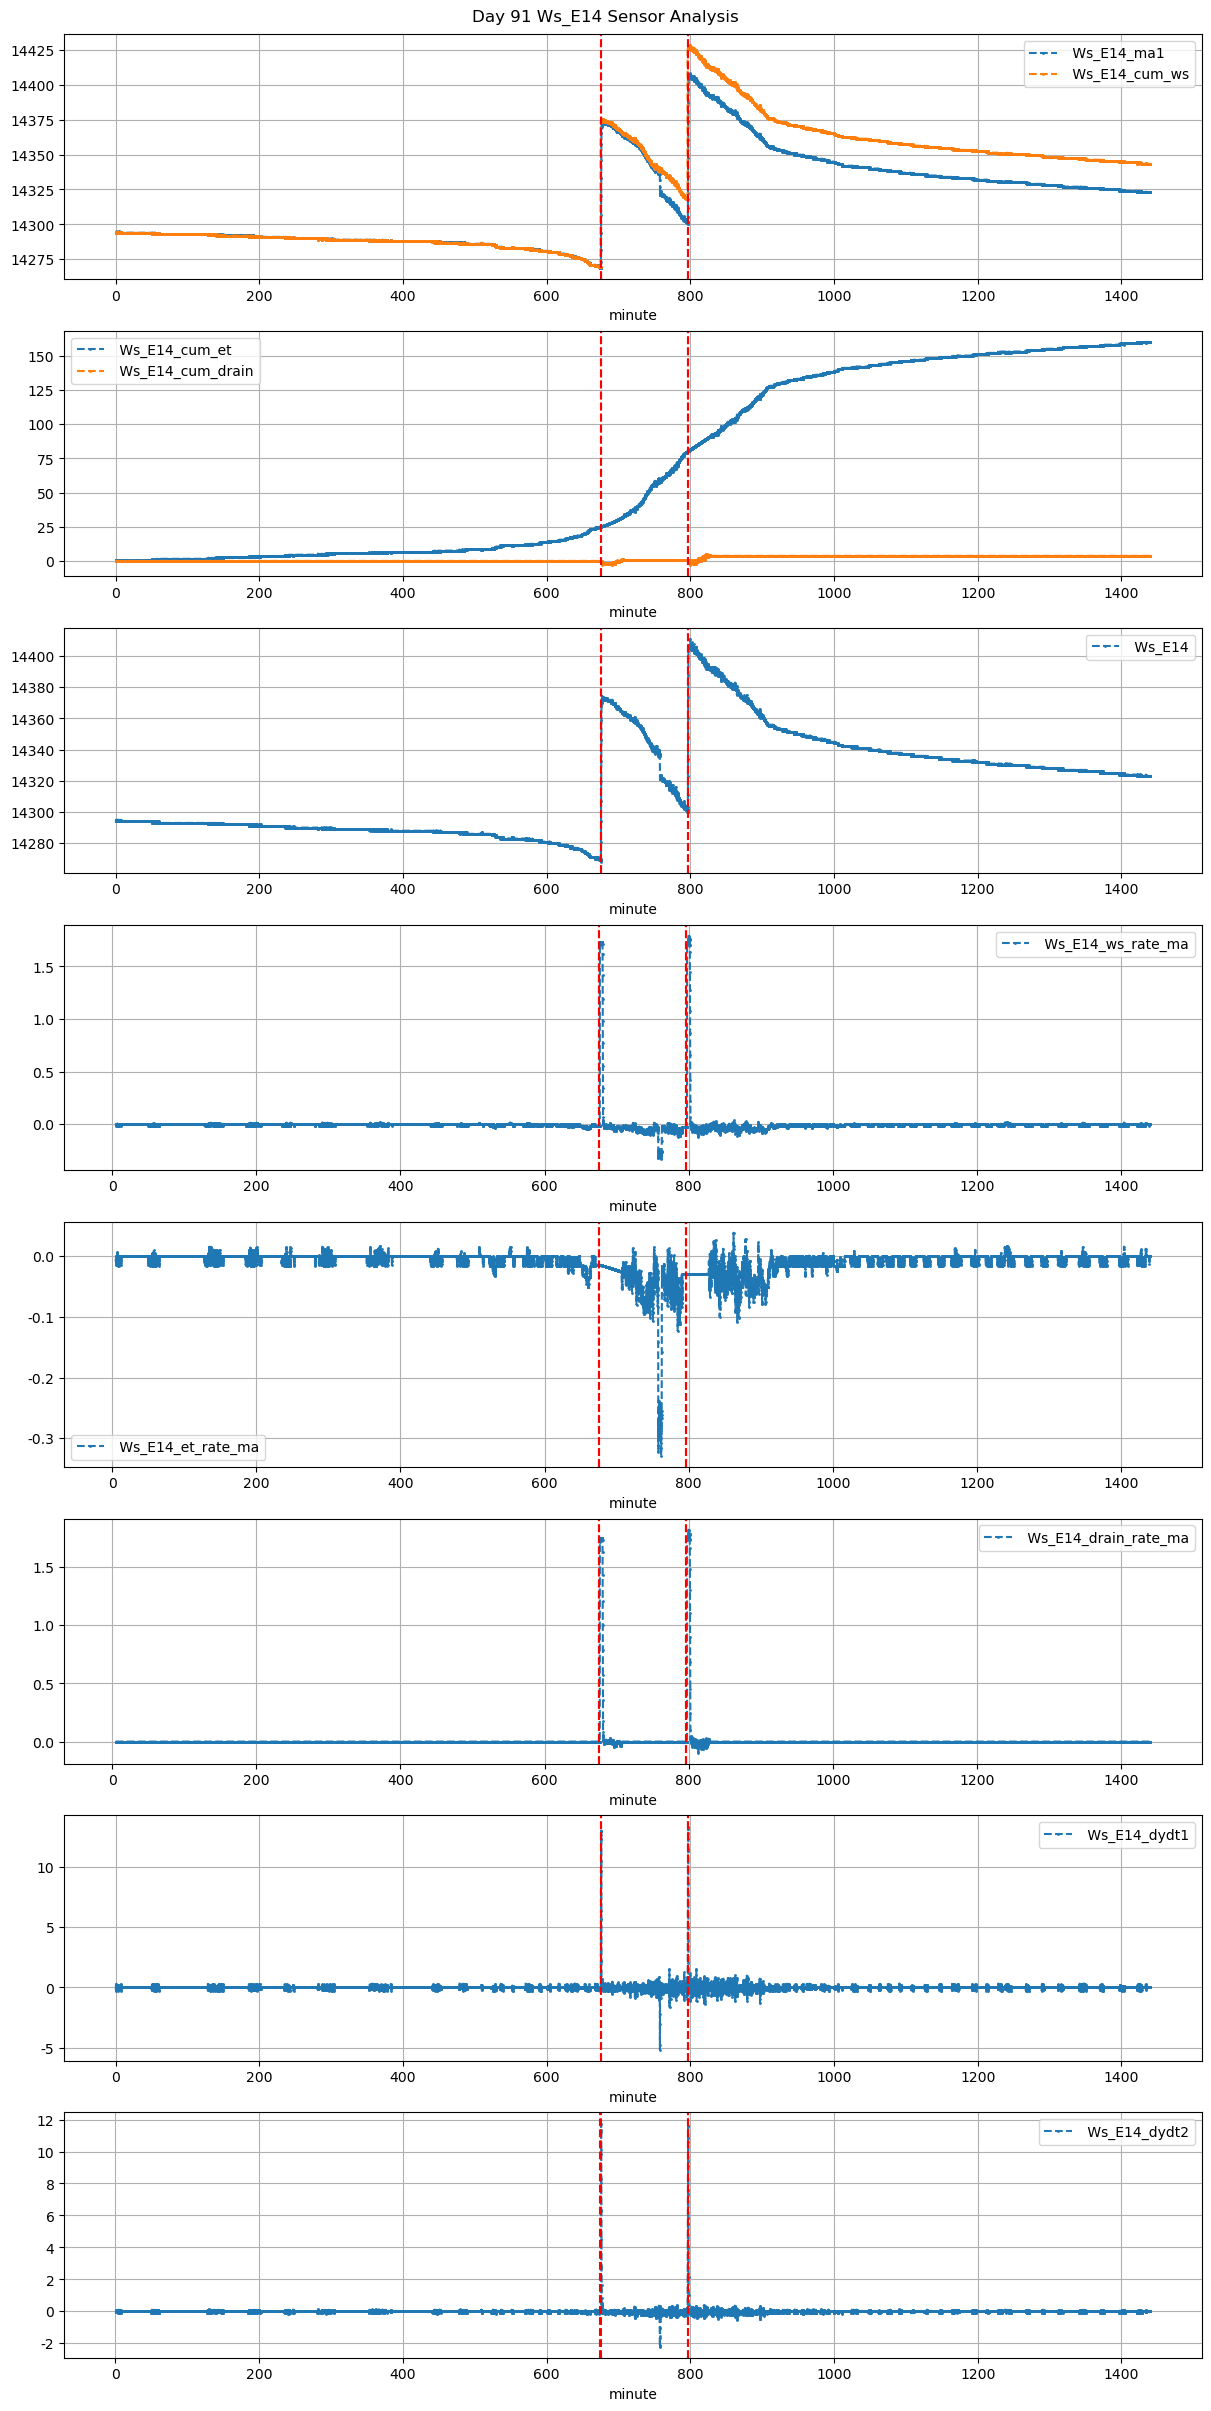
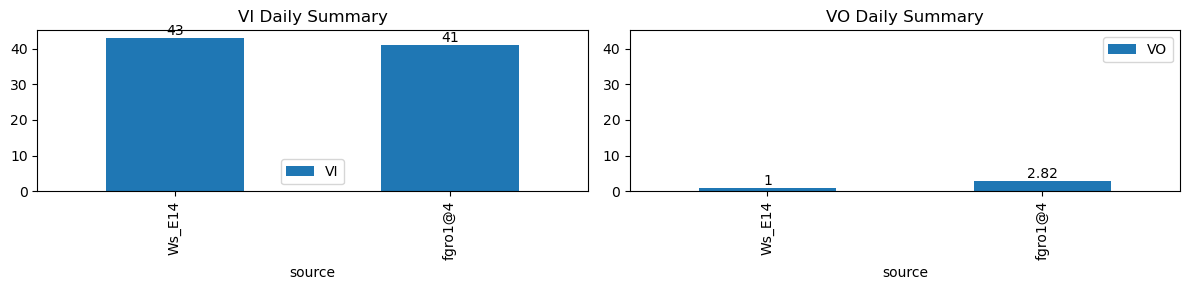
VI and VO Daily Summary
| ws_name | total_dp | nan_dp | nan_filled_dp | long_gap_dp | num_spike |
|---|---|---|---|---|---|
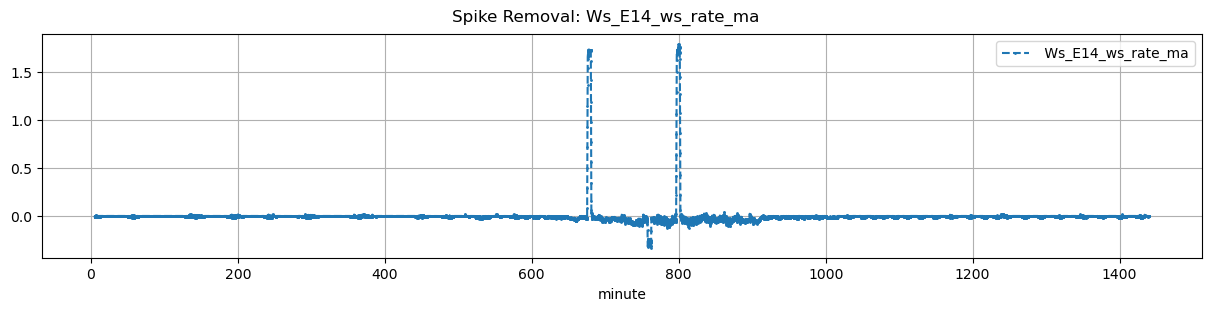
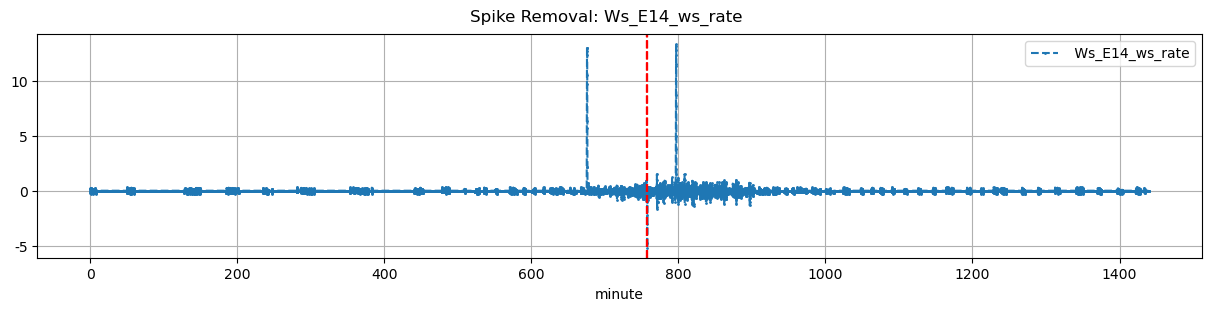
| Ws_E14 | 17280 | 0 | 13875 | 0 | 3 |
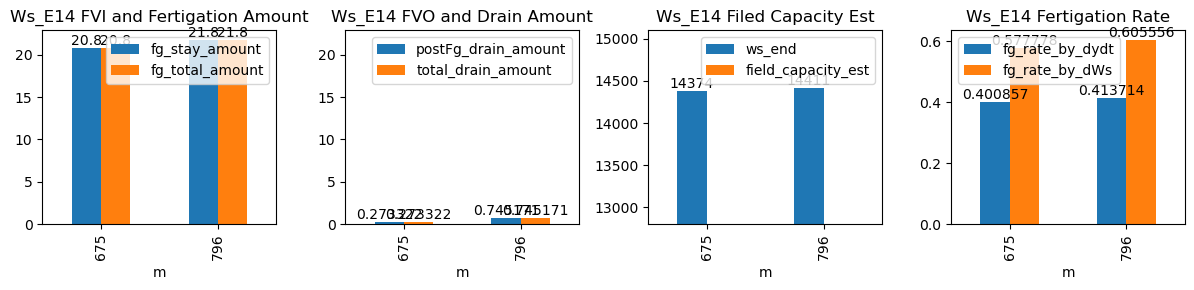
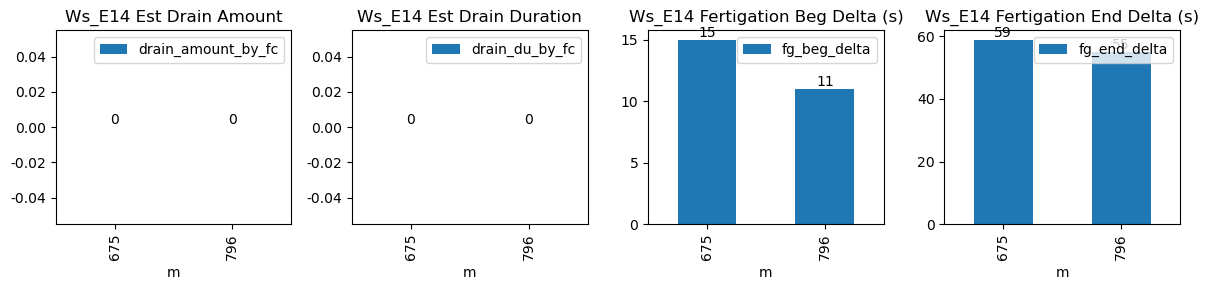
| ds | d | m | ws_name | prominence_cut | max_drain_du | fg_beg | fg_beg_est | fg_end | fg_end_est | drain_amount_by_fc | drain_du_by_fc | drain_rate_by_fc | ws_beg | ws_end | duc | pre_fg_et | post_fg_ws | post_drn_et | fg_rate_by_dydt | fg_rate_by_dWs | fg_stay_amount | fg_beg_delta | fg_end_delta | fg_total_amount | fg_drain_amount | postFg_drain_amount | field_capacity_est | total_drain_amount |
|---|---|---|---|---|---|---|---|---|---|---|---|---|---|---|---|---|---|---|---|---|---|---|---|---|---|---|---|---|
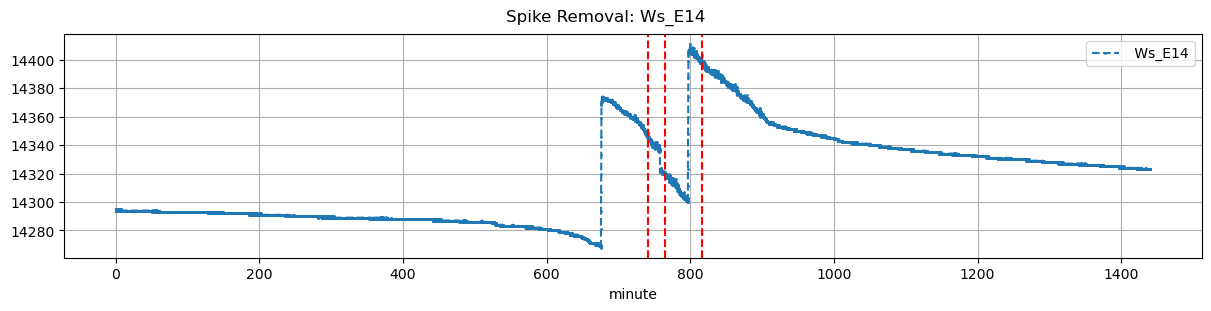
| 2026-01-05 11:15:00+08:00 | 91 | 675 | Ws_E14 | 0.31391 | 30 | 675.00 | 675.250000 | 675.60 | 676.583333 | NaN | NaN | NaN | 14270.0 | 14374.0 | 36 | -0.013795 | -0.018194 | -0.025139 | 0.400857 | 0.577778 | 20.8 | 15.0 | 59.0 | 20.8 | 0.0 | 0.273322 | NaN | 0.273322 |
| 2026-01-05 13:16:09+08:00 | 91 | 796 | Ws_E14 | 0.31391 | 30 | 796.15 | 796.333333 | 796.75 | 797.666667 | NaN | NaN | NaN | 14302.0 | 14411.0 | 36 | -0.037101 | -0.029861 | -0.028819 | 0.413714 | 0.605556 | 21.8 | 11.0 | 55.0 | 21.8 | 0.0 | 0.745171 | NaN | 0.745171 |