| 2025-12-29 10:10:00+08:00 |
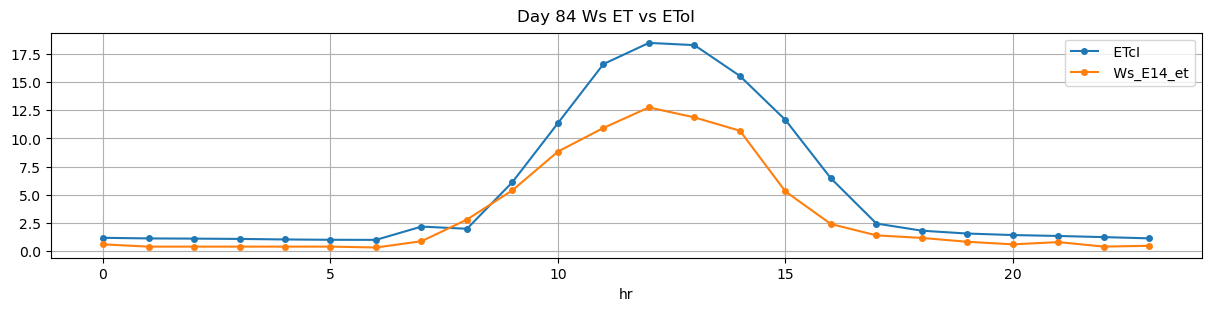
84 |
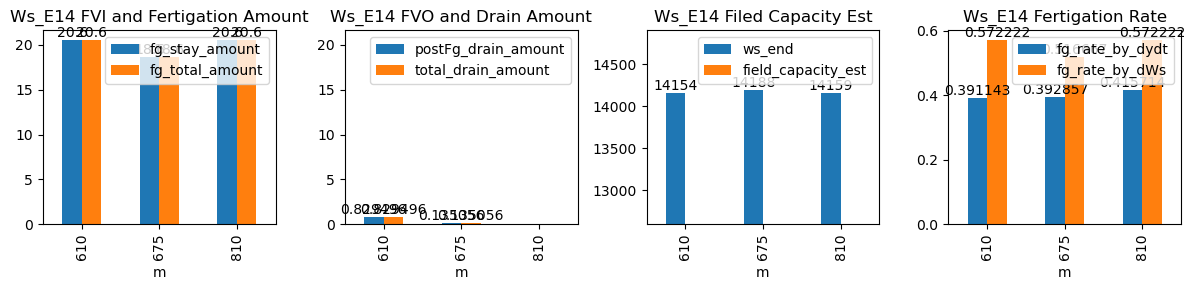
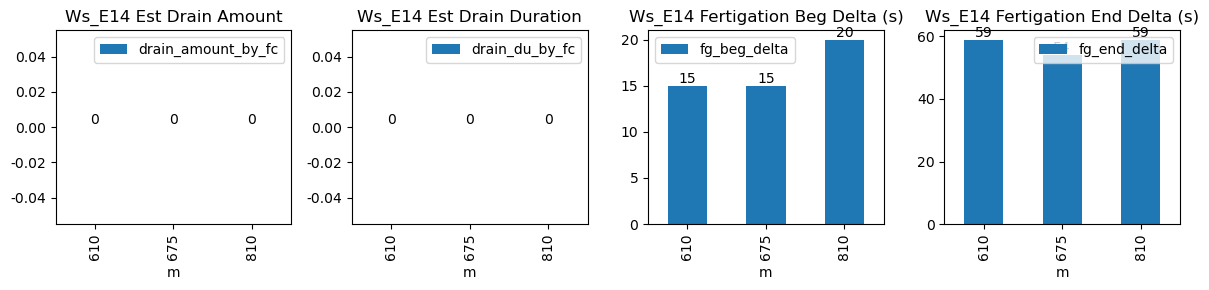
610 |
Ws_E14 |
0.341713 |
30 |
610.0 |
610.250000 |
610.6 |
611.583333 |
NaN |
NaN |
NaN |
14051.0 |
14154.0 |
36 |
-0.036864 |
-0.070556 |
-0.081302 |
0.391143 |
0.572222 |
20.6 |
15.0 |
59.0 |
20.6 |
0.0 |
0.829496 |
NaN |
0.829496 |
| 2025-12-29 11:15:00+08:00 |
84 |
675 |
Ws_E14 |
0.341713 |
30 |
675.0 |
675.250000 |
675.6 |
676.500000 |
NaN |
NaN |
NaN |
14095.0 |
14188.0 |
36 |
-0.103037 |
-0.070000 |
-0.072755 |
0.392857 |
0.516667 |
18.6 |
15.0 |
54.0 |
18.6 |
0.0 |
0.135056 |
NaN |
0.135056 |
| 2025-12-29 13:30:00+08:00 |
84 |
810 |
Ws_E14 |
0.341713 |
30 |
810.0 |
810.333333 |
810.6 |
811.583333 |
NaN |
NaN |
NaN |
14056.0 |
14159.0 |
36 |
-0.109927 |
-0.088750 |
-0.066560 |
0.415714 |
0.572222 |
20.6 |
20.0 |
59.0 |
20.6 |
0.0 |
-0.657358 |
NaN |
-0.657358 |