| 2025-12-28 10:00:00+08:00 |
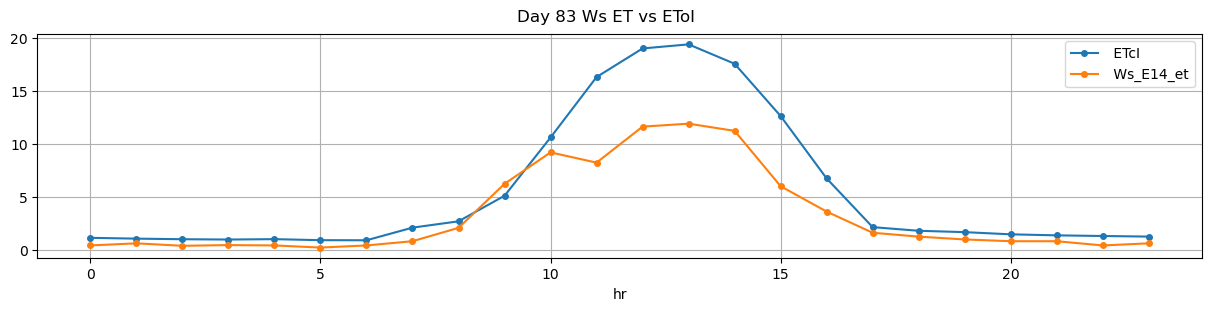
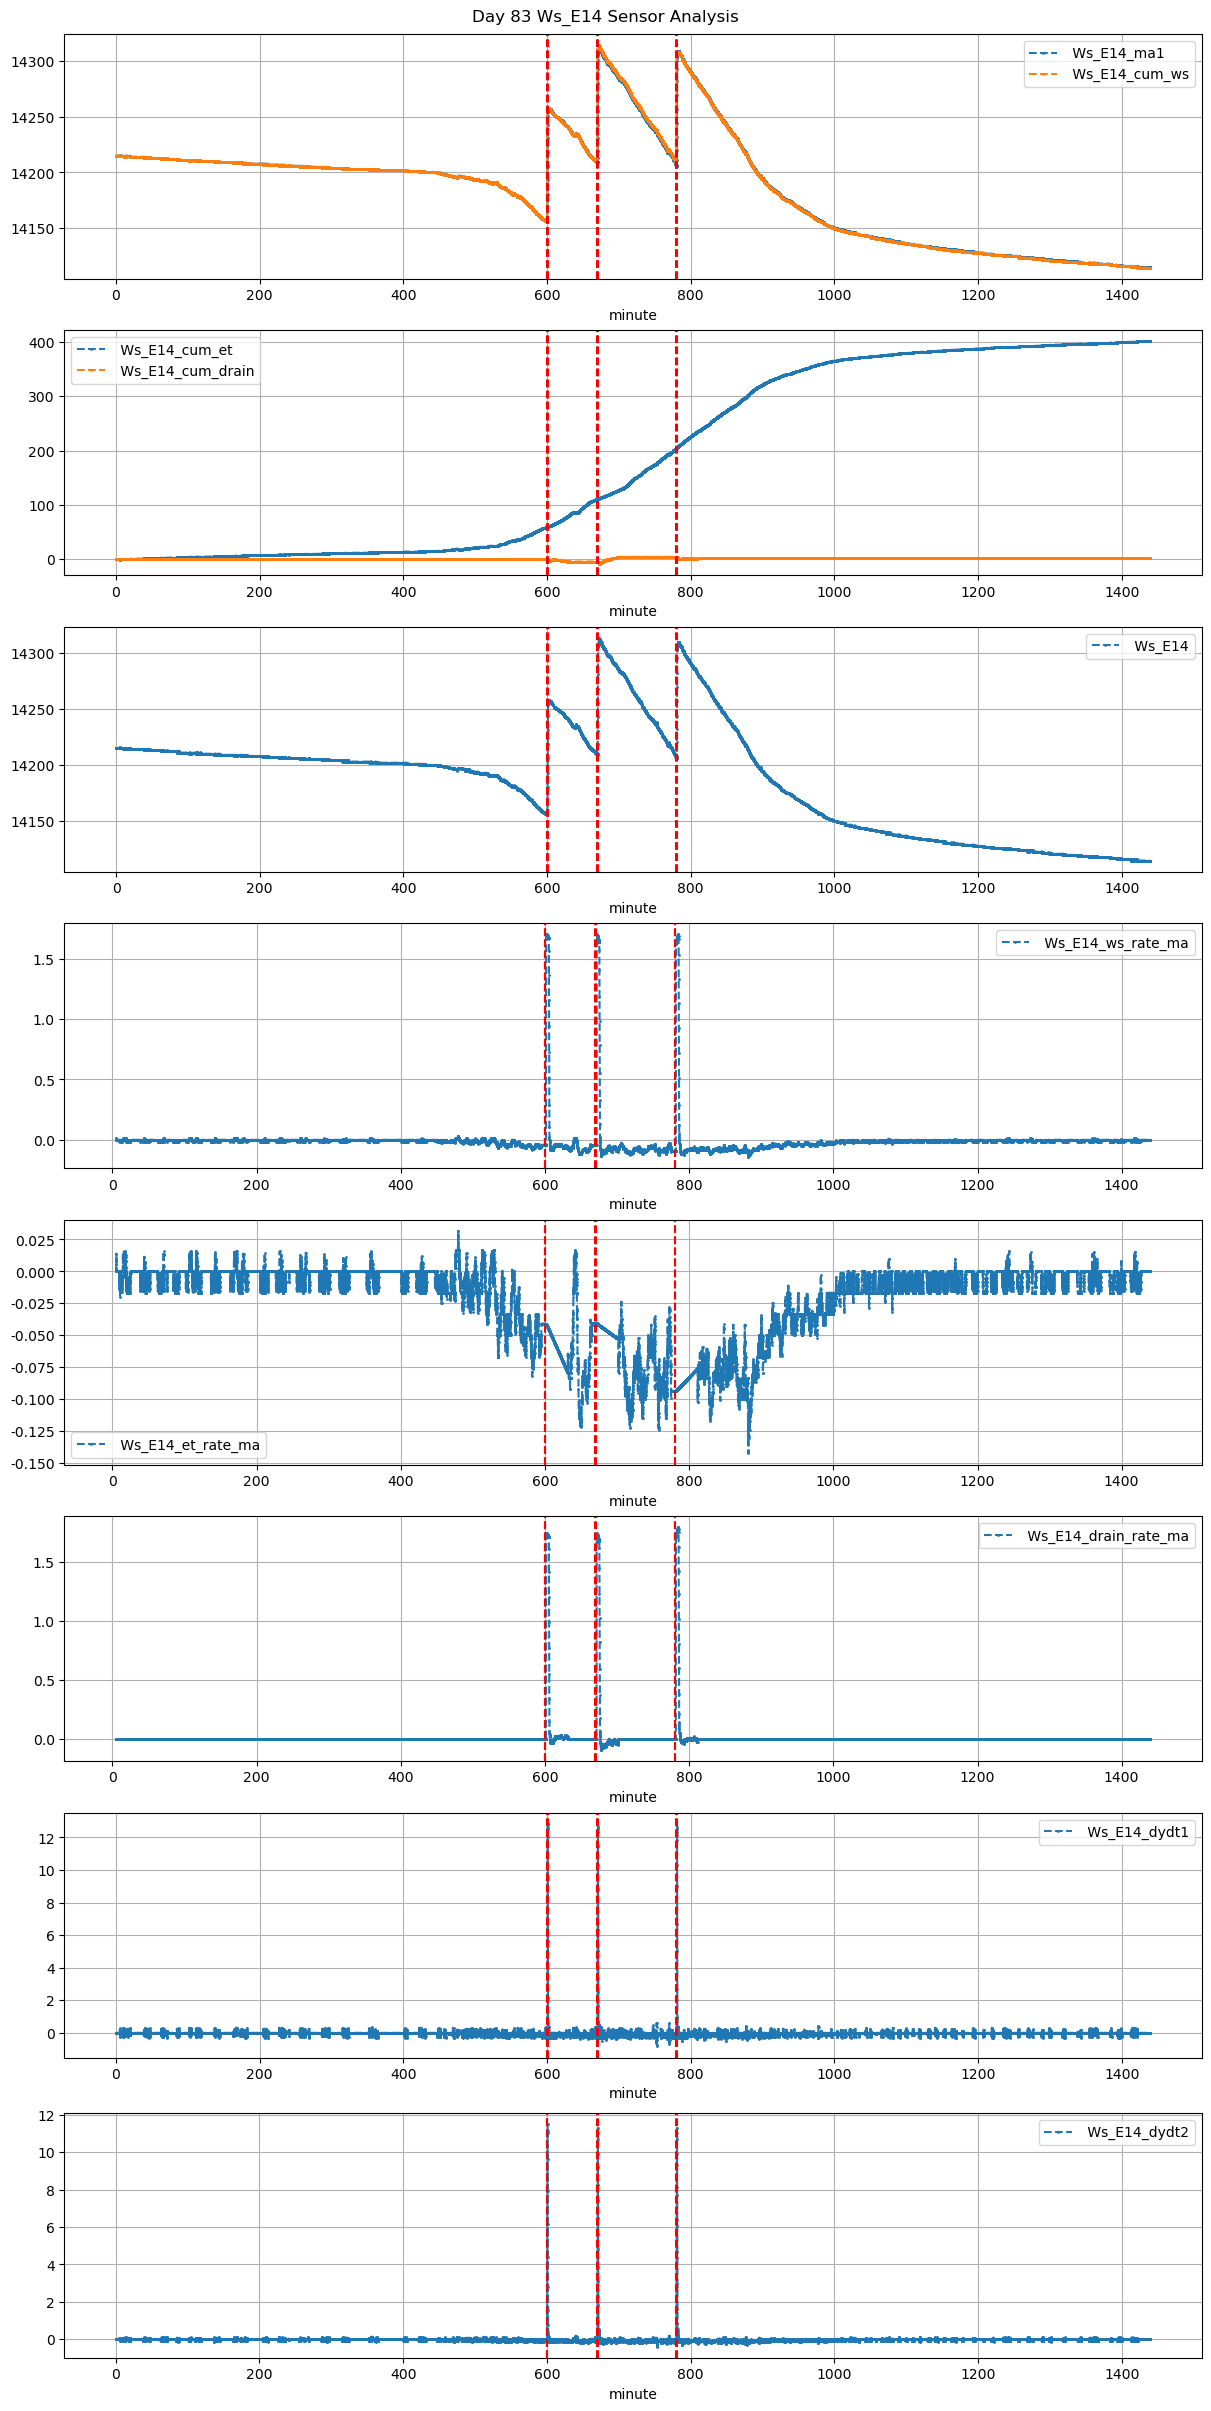
83 |
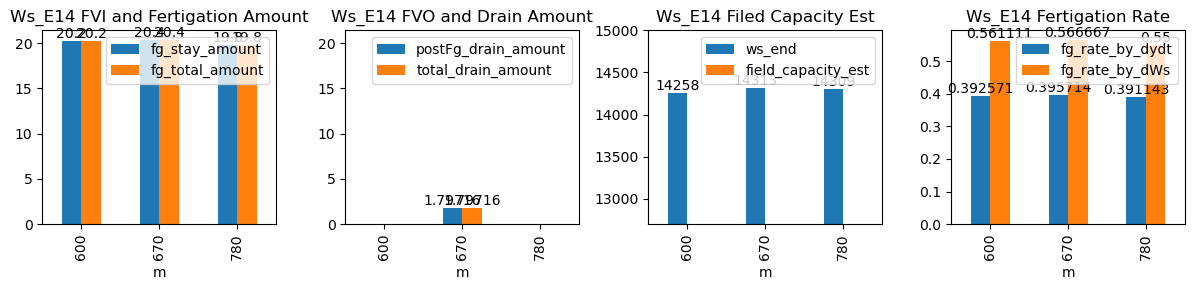
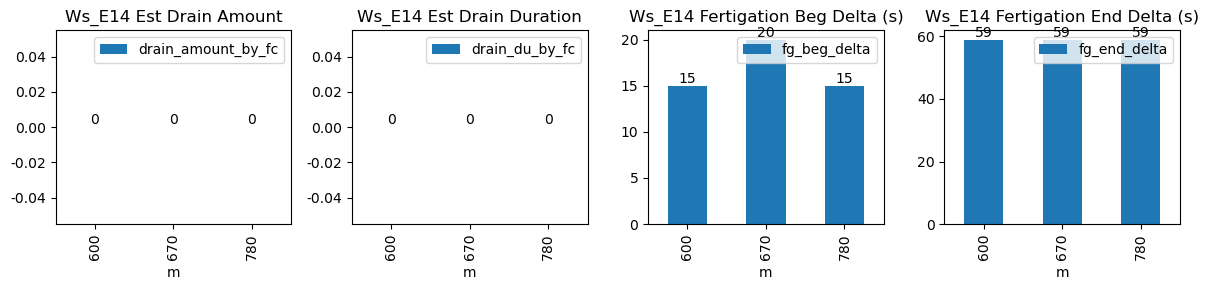
600 |
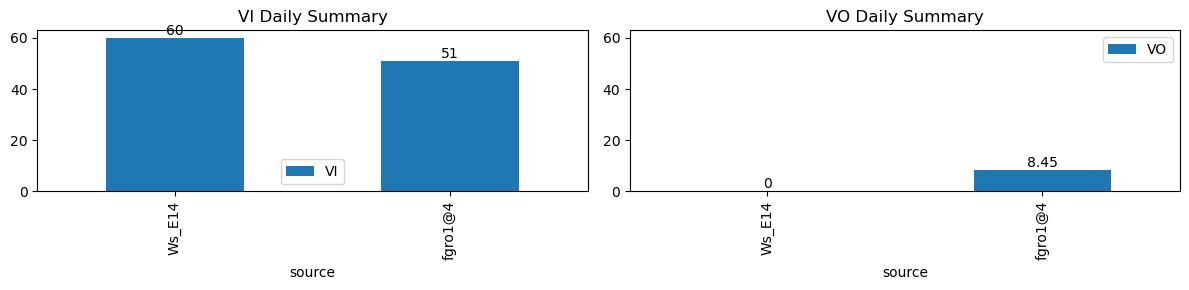
Ws_E14 |
0.233075 |
30 |
600.0 |
600.250000 |
600.6 |
601.583333 |
NaN |
NaN |
NaN |
14157.0 |
14258.0 |
36 |
-0.040819 |
-0.070694 |
-0.079417 |
0.392571 |
0.561111 |
20.2 |
15.0 |
59.0 |
20.2 |
0.0 |
-0.815279 |
NaN |
-0.815279 |
| 2025-12-28 11:10:00+08:00 |
83 |
670 |
Ws_E14 |
0.233075 |
30 |
670.0 |
670.333333 |
670.6 |
671.583333 |
NaN |
NaN |
NaN |
14211.0 |
14313.0 |
36 |
-0.040678 |
-0.097083 |
-0.052917 |
0.395714 |
0.566667 |
20.4 |
20.0 |
59.0 |
20.4 |
0.0 |
1.797165 |
NaN |
1.797165 |
| 2025-12-28 13:00:00+08:00 |
83 |
780 |
Ws_E14 |
0.233075 |
30 |
780.0 |
780.250000 |
780.6 |
781.583333 |
NaN |
NaN |
NaN |
14210.0 |
14309.0 |
36 |
-0.107963 |
-0.093472 |
-0.075820 |
0.391143 |
0.550000 |
19.8 |
15.0 |
59.0 |
19.8 |
0.0 |
-0.542346 |
NaN |
-0.542346 |