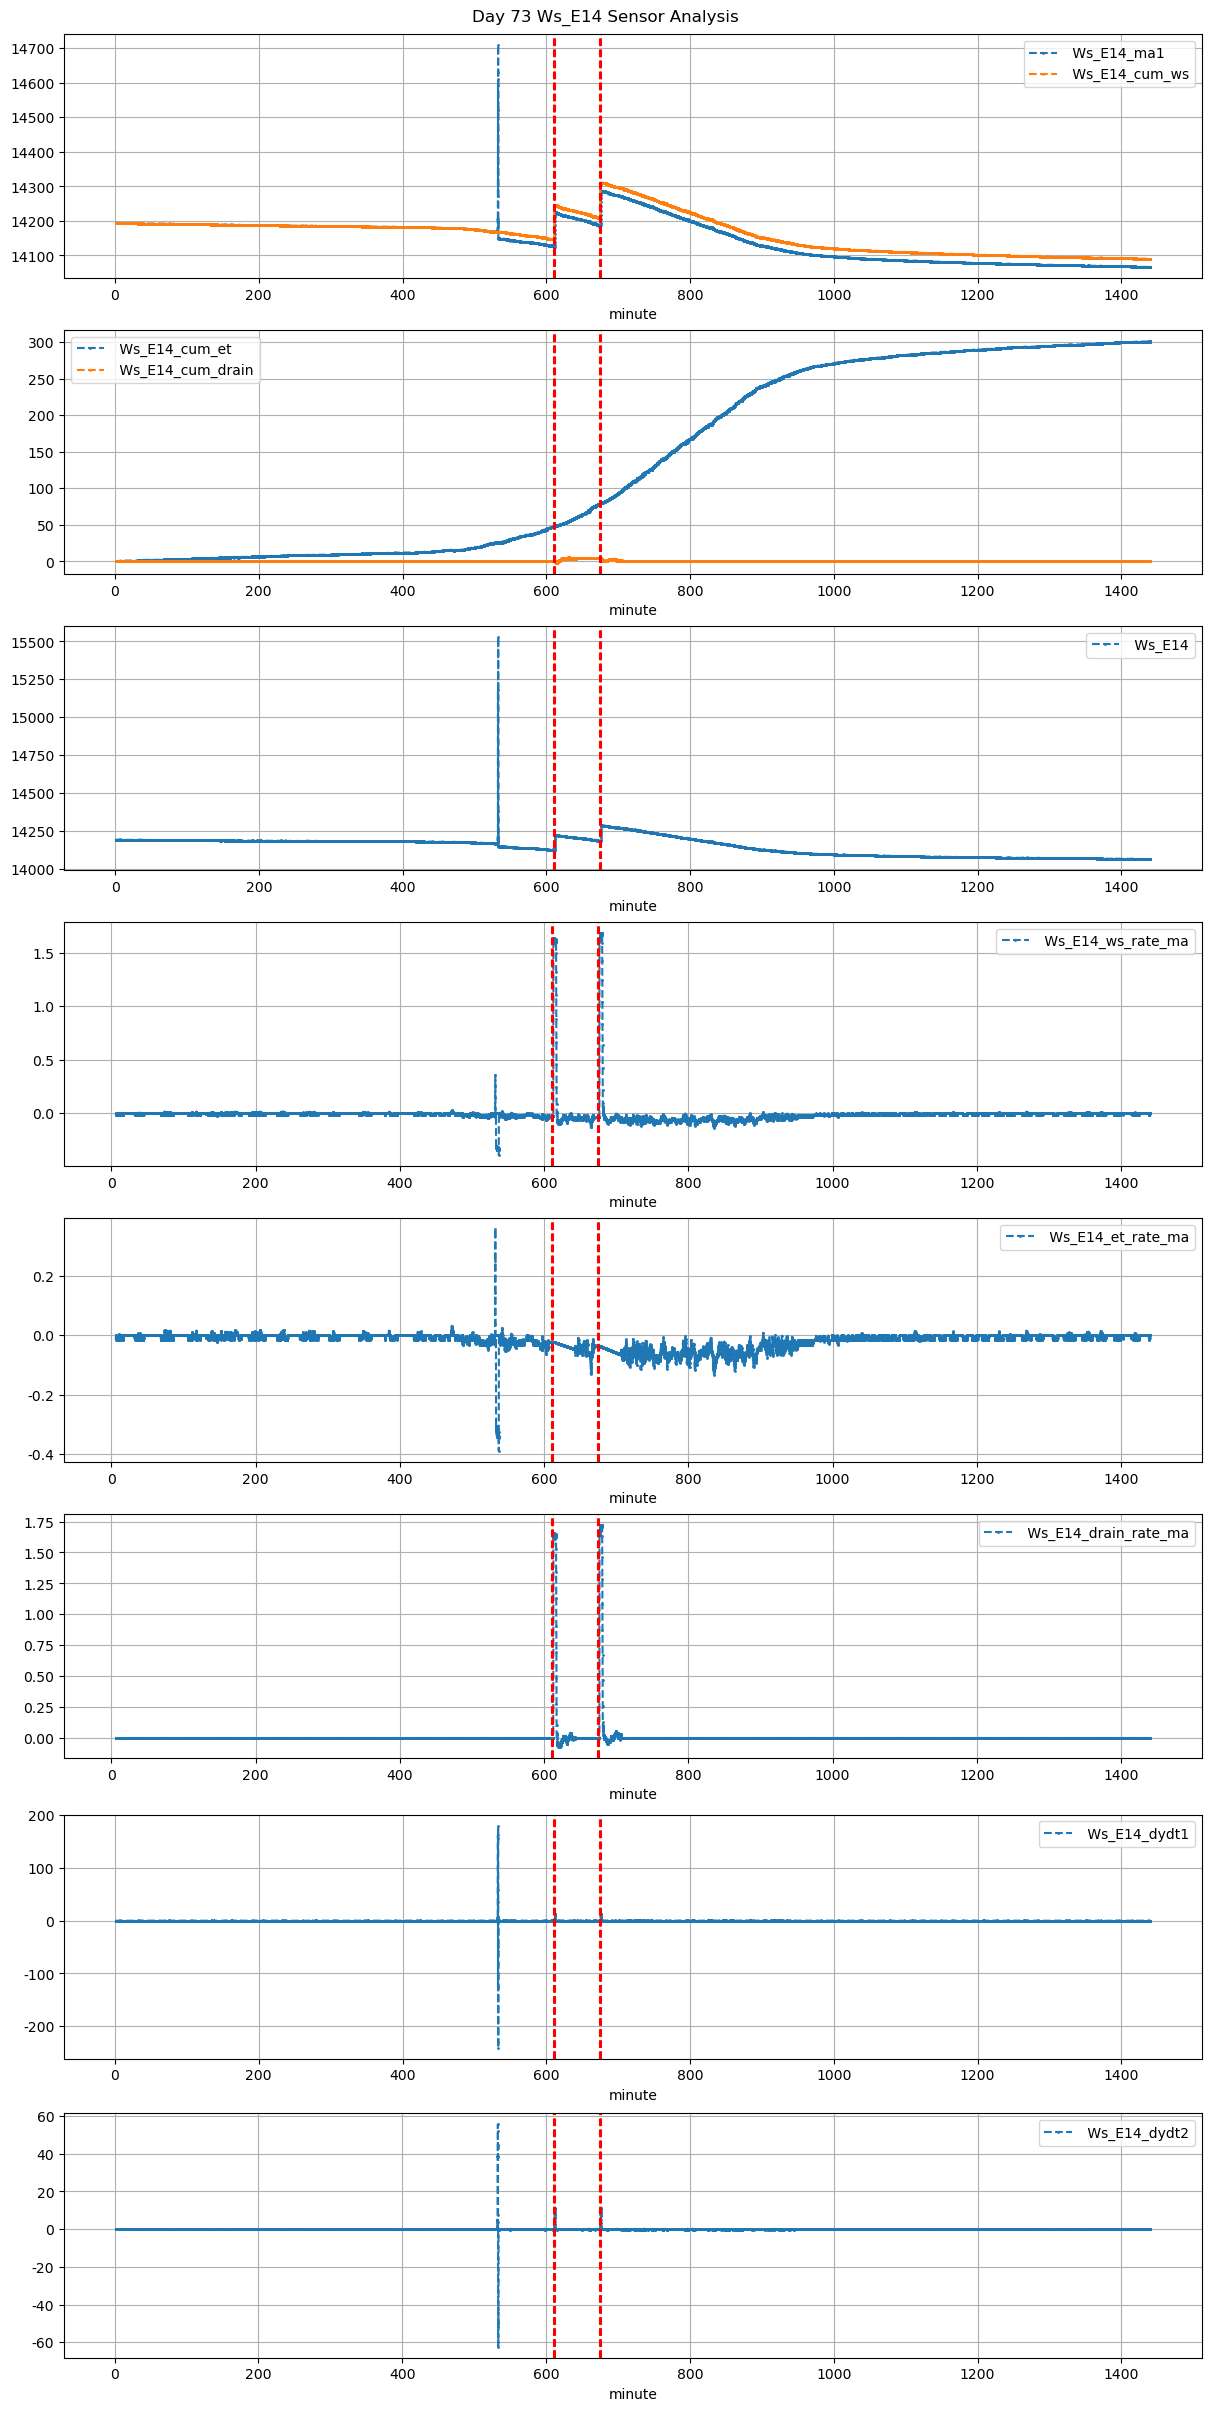
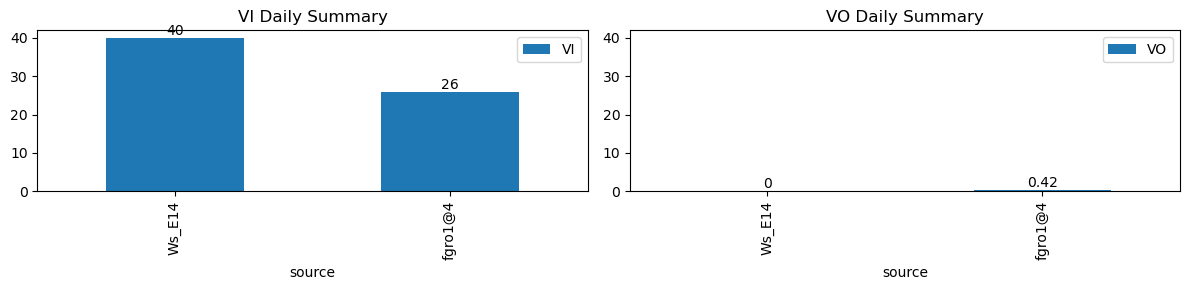
VI and VO Daily Summary
| ws_name | total_dp | nan_dp | nan_filled_dp | long_gap_dp | num_spike |
|---|---|---|---|---|---|
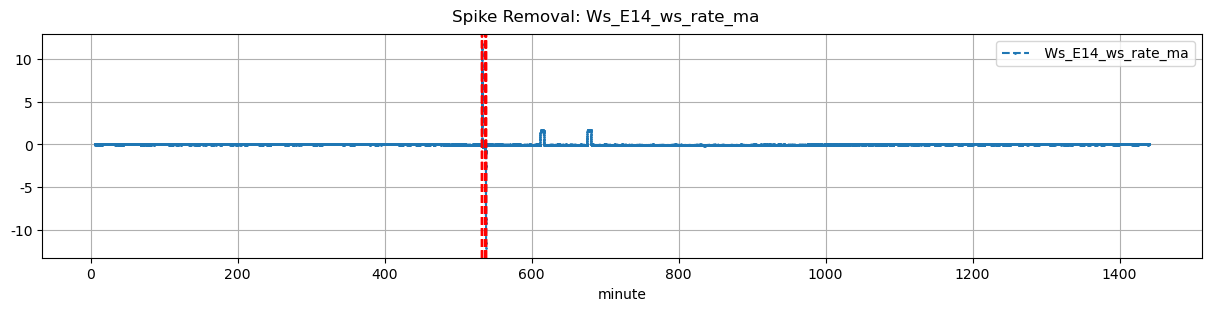
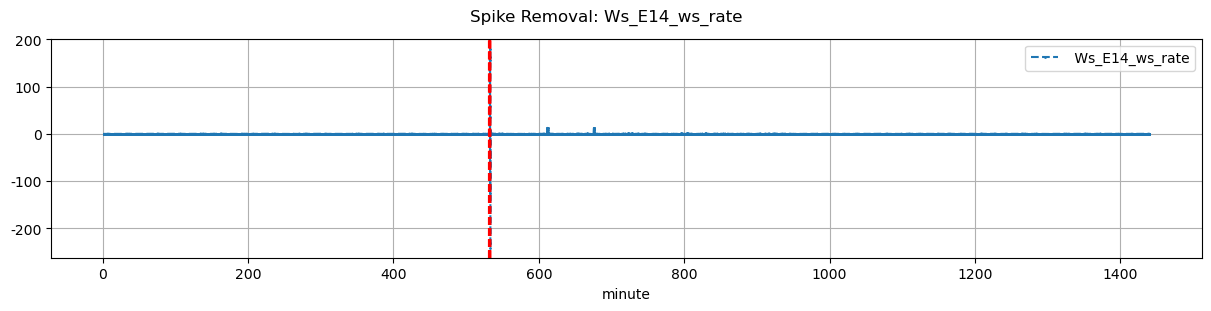
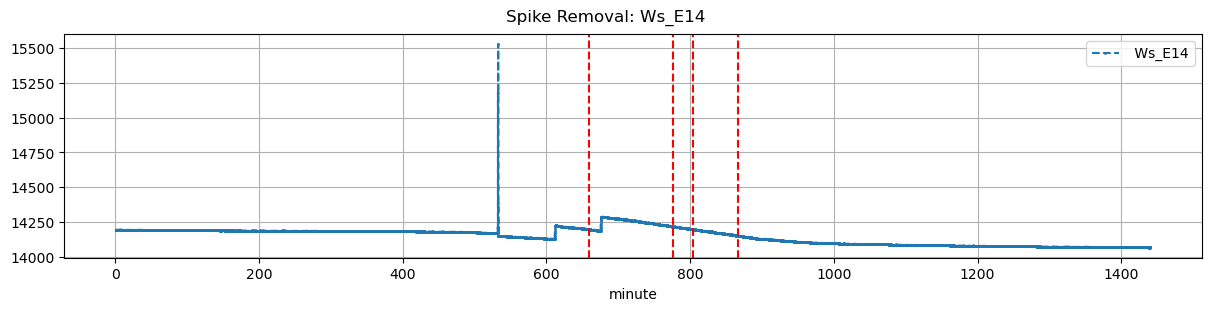
| Ws_E14 | 17268 | 0 | 13763 | 0 | 4 |
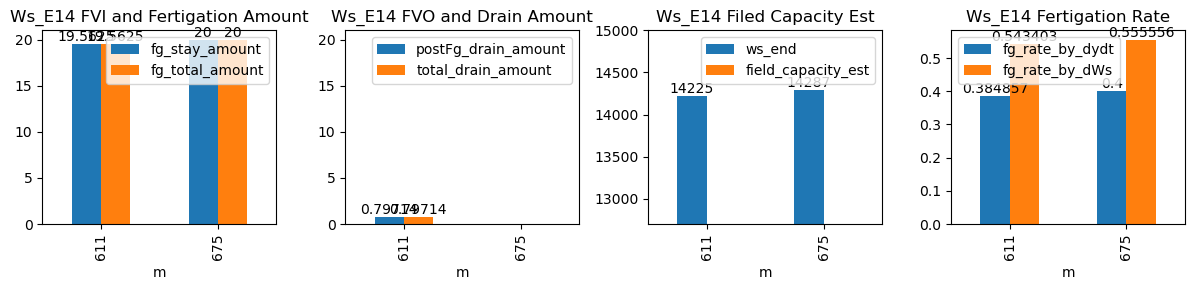
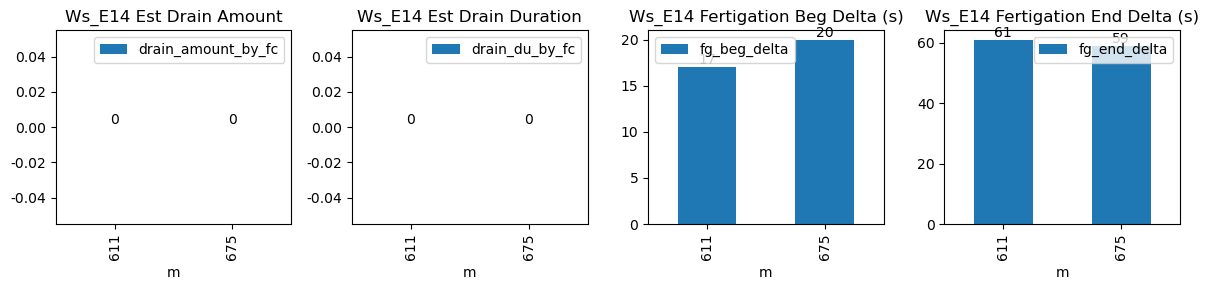
| ds | d | m | ws_name | prominence_cut | max_drain_du | fg_beg | fg_beg_est | fg_end | fg_end_est | drain_amount_by_fc | drain_du_by_fc | drain_rate_by_fc | ws_beg | ws_end | duc | pre_fg_et | post_fg_ws | post_drn_et | fg_rate_by_dydt | fg_rate_by_dWs | fg_stay_amount | fg_beg_delta | fg_end_delta | fg_total_amount | fg_drain_amount | postFg_drain_amount | field_capacity_est | total_drain_amount |
|---|---|---|---|---|---|---|---|---|---|---|---|---|---|---|---|---|---|---|---|---|---|---|---|---|---|---|---|---|
| 2025-12-18 10:11:03+08:00 | 73 | 611 | Ws_E14 | 5.555768 | 30 | 611.05 | 611.333333 | 611.65 | 612.666667 | NaN | NaN | NaN | 14127.1875 | 14225.0 | 36 | -0.021551 | -0.080833 | -0.047123 | 0.384857 | 0.543403 | 19.5625 | 17.0 | 61.0 | 19.5625 | 0.0 | 0.797140 | NaN | 0.797140 |
| 2025-12-18 11:15:00+08:00 | 73 | 675 | Ws_E14 | 5.555768 | 30 | 675.00 | 675.333333 | 675.60 | 676.583333 | NaN | NaN | NaN | 14187.0000 | 14287.0 | 36 | -0.069209 | -0.035694 | -0.065227 | 0.400000 | 0.555556 | 20.0000 | 20.0 | 59.0 | 20.0000 | 0.0 | -0.881391 | NaN | -0.881391 |