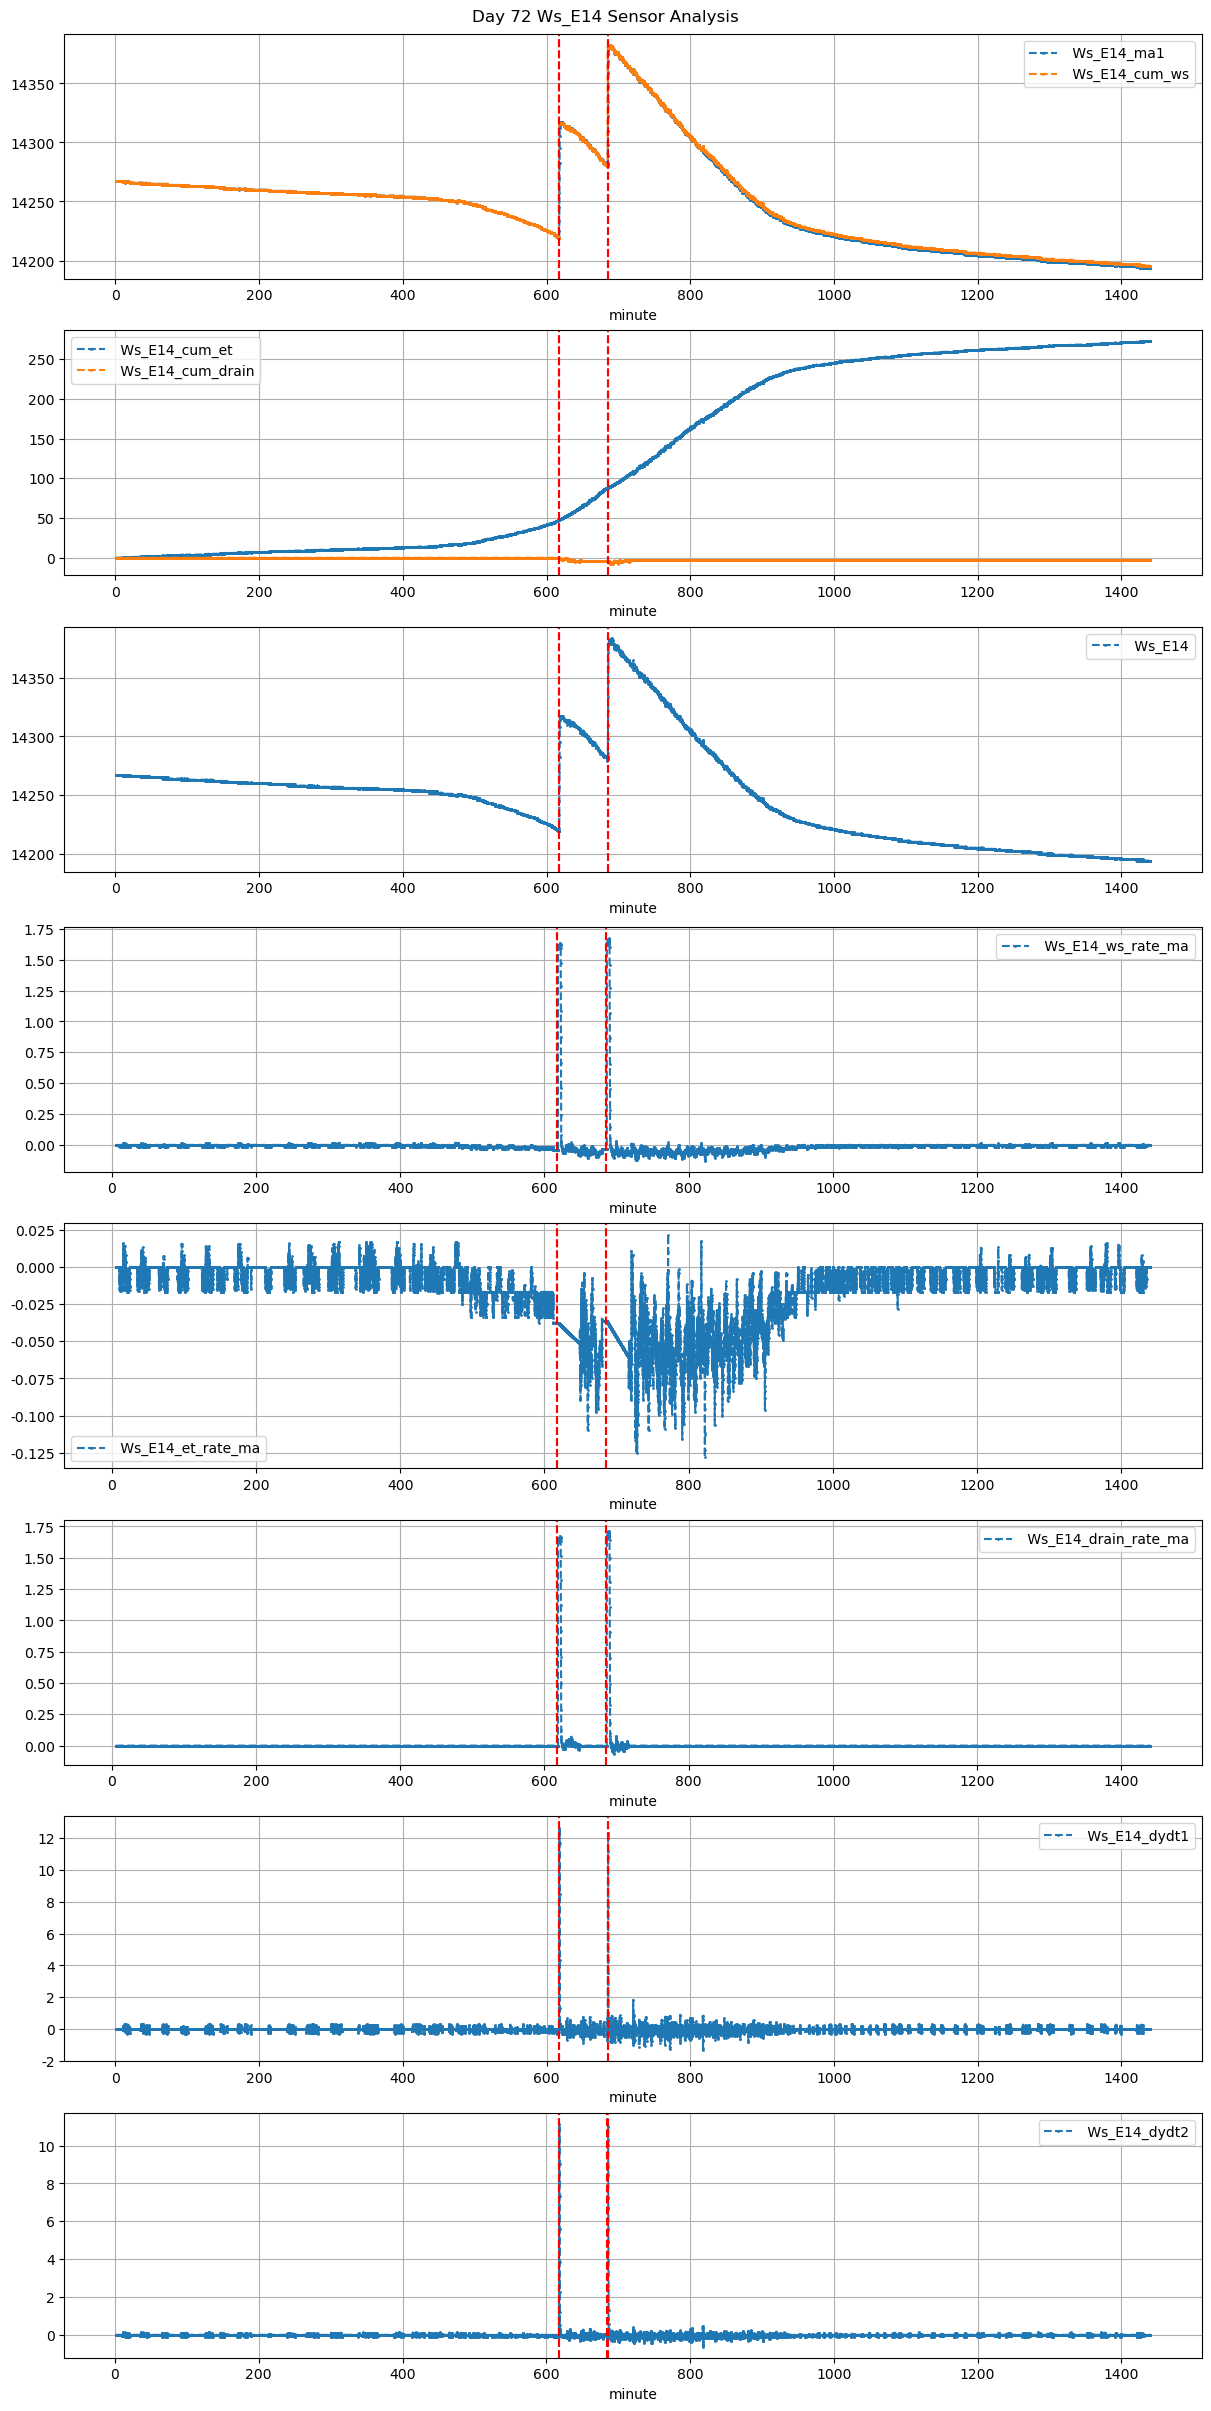
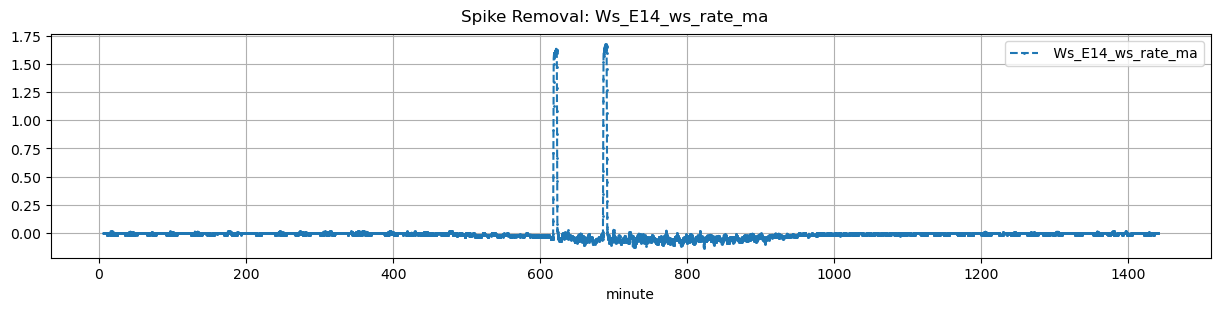
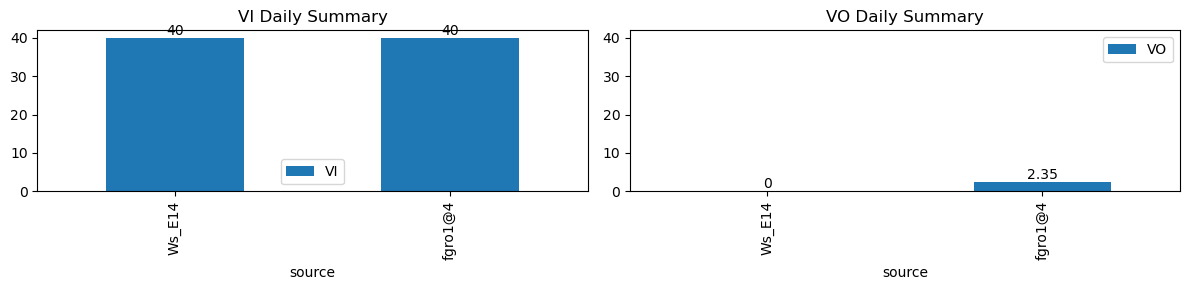
VI and VO Daily Summary
| ws_name | total_dp | nan_dp | nan_filled_dp | long_gap_dp | num_spike |
|---|---|---|---|---|---|
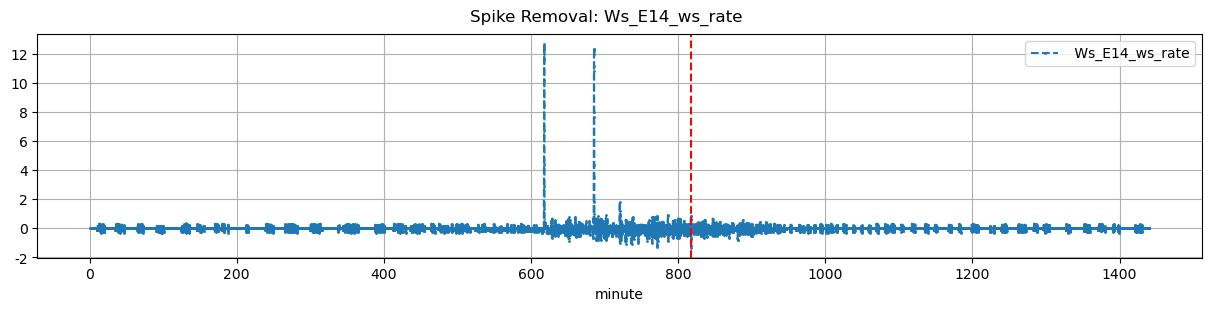
| Ws_E14 | 17268 | 0 | 13671 | 0 | 5 |
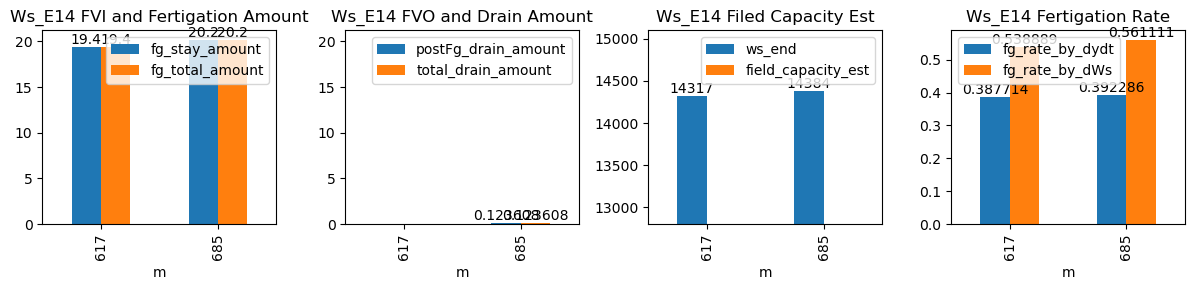
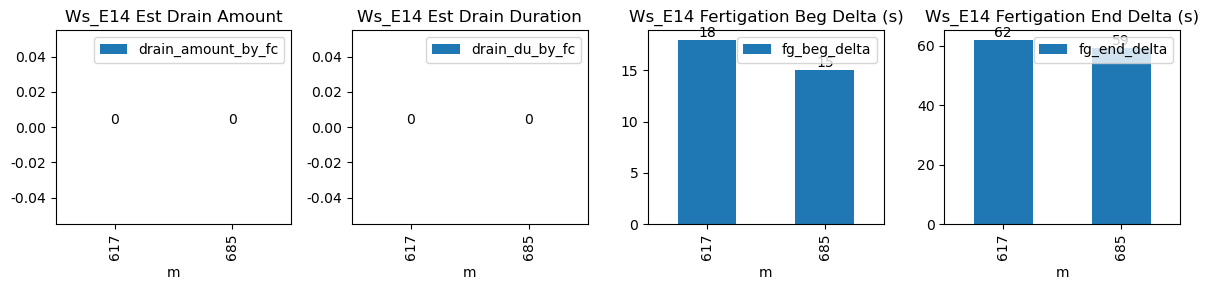
| ds | d | m | ws_name | prominence_cut | max_drain_du | fg_beg | fg_beg_est | fg_end | fg_end_est | drain_amount_by_fc | drain_du_by_fc | drain_rate_by_fc | ws_beg | ws_end | duc | pre_fg_et | post_fg_ws | post_drn_et | fg_rate_by_dydt | fg_rate_by_dWs | fg_stay_amount | fg_beg_delta | fg_end_delta | fg_total_amount | fg_drain_amount | postFg_drain_amount | field_capacity_est | total_drain_amount |
|---|---|---|---|---|---|---|---|---|---|---|---|---|---|---|---|---|---|---|---|---|---|---|---|---|---|---|---|---|
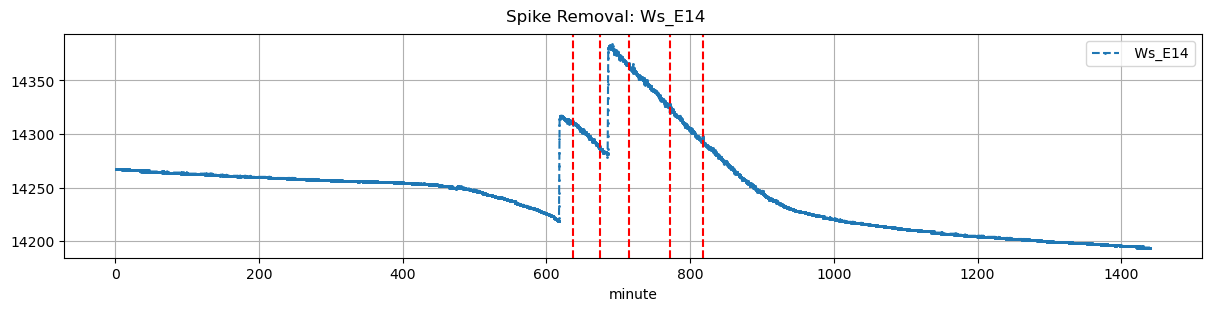
| 2025-12-17 10:17:12+08:00 | 72 | 617 | Ws_E14 | 0.258403 | 30 | 617.2 | 617.50 | 617.8 | 618.833333 | NaN | NaN | NaN | 14220.0 | 14317.0 | 36 | -0.037500 | -0.049722 | -0.051389 | 0.387714 | 0.538889 | 19.4 | 18.0 | 62.0 | 19.4 | 0.0 | -0.554119 | NaN | -0.554119 |
| 2025-12-17 11:25:00+08:00 | 72 | 685 | Ws_E14 | 0.258403 | 30 | 685.0 | 685.25 | 685.6 | 686.583333 | NaN | NaN | NaN | 14283.0 | 14384.0 | 36 | -0.036511 | -0.053333 | -0.060625 | 0.392286 | 0.561111 | 20.2 | 15.0 | 59.0 | 20.2 | 0.0 | 0.123608 | NaN | 0.123608 |