| 2025-12-16 09:52:14+08:00 |
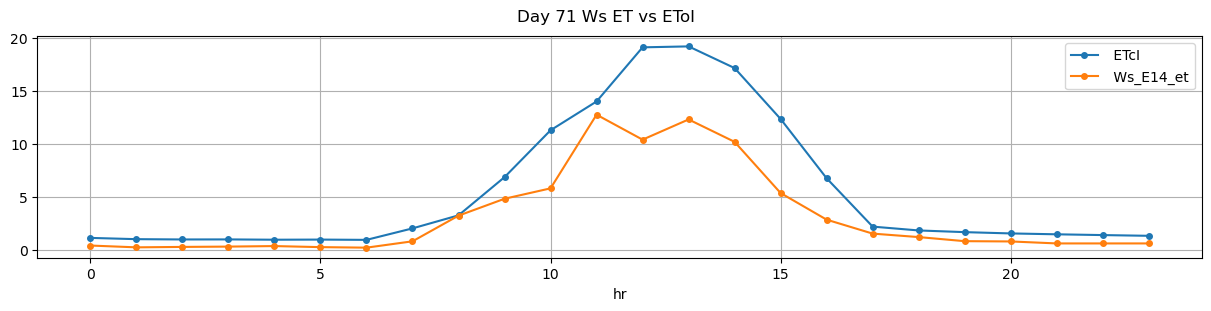
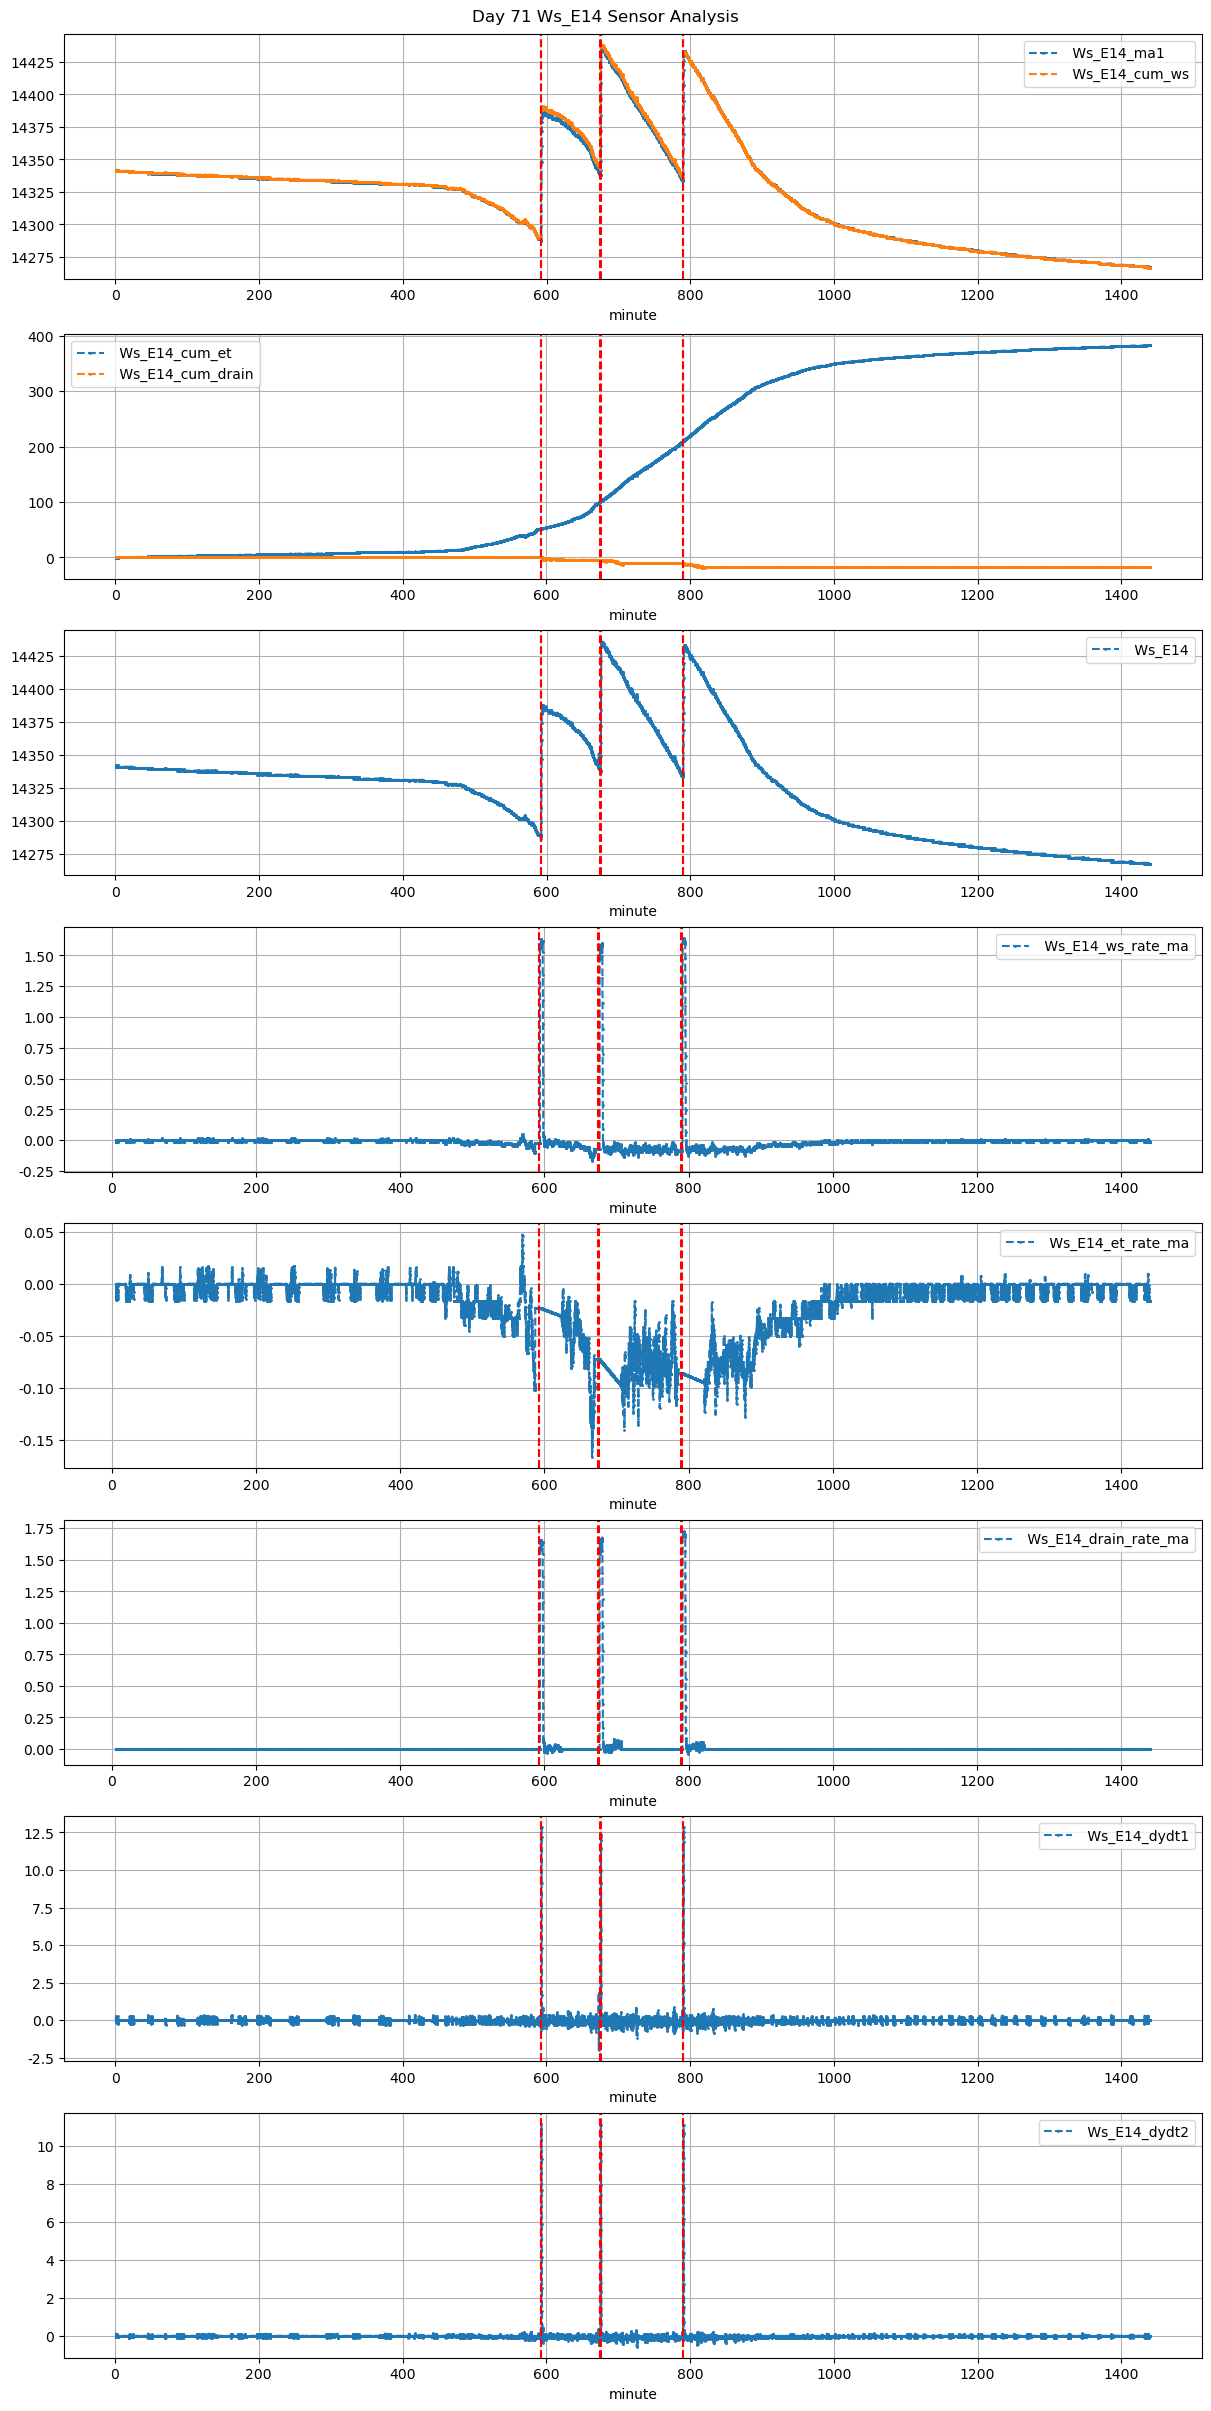
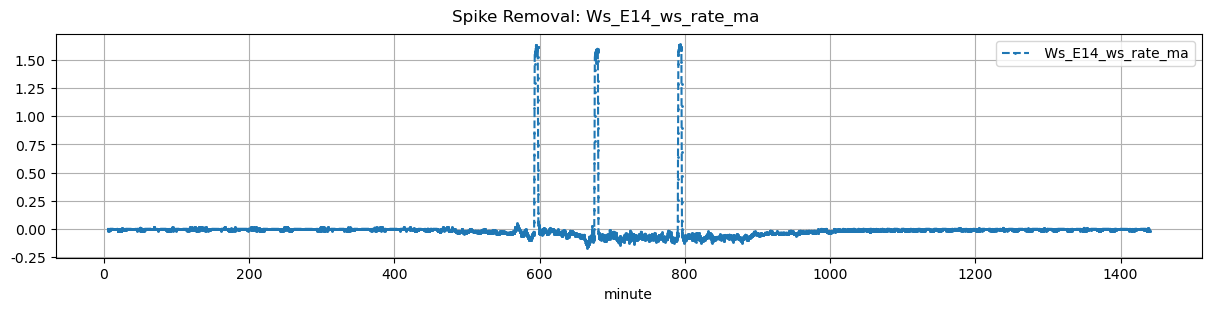
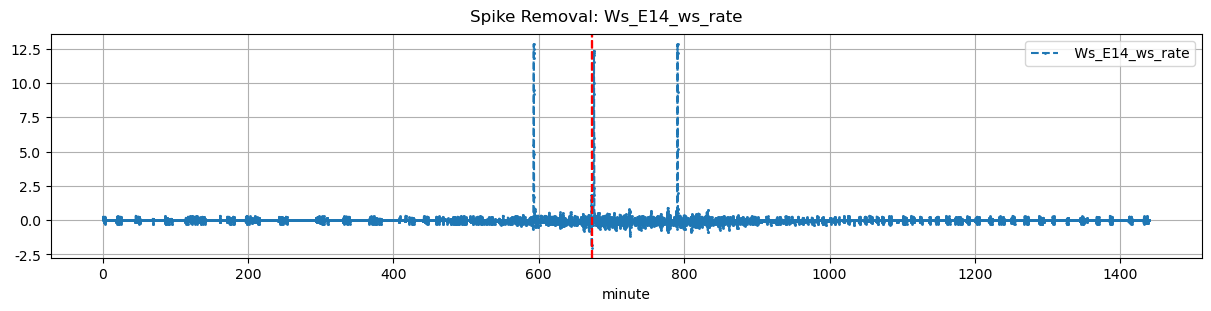
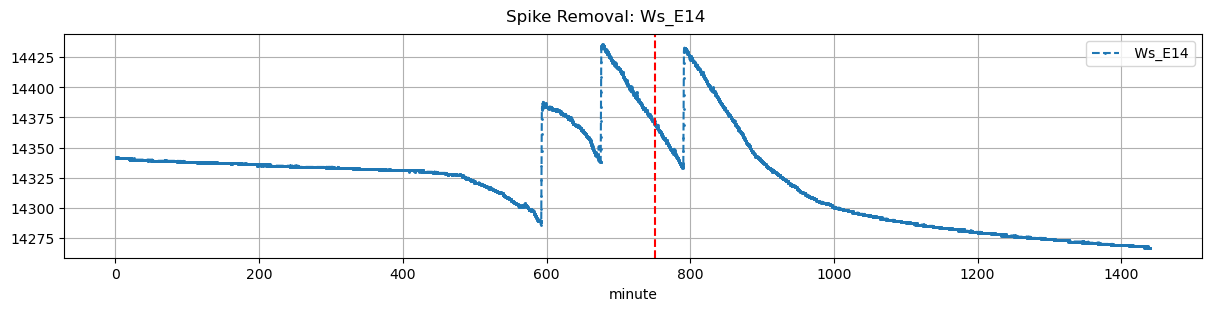
71 |
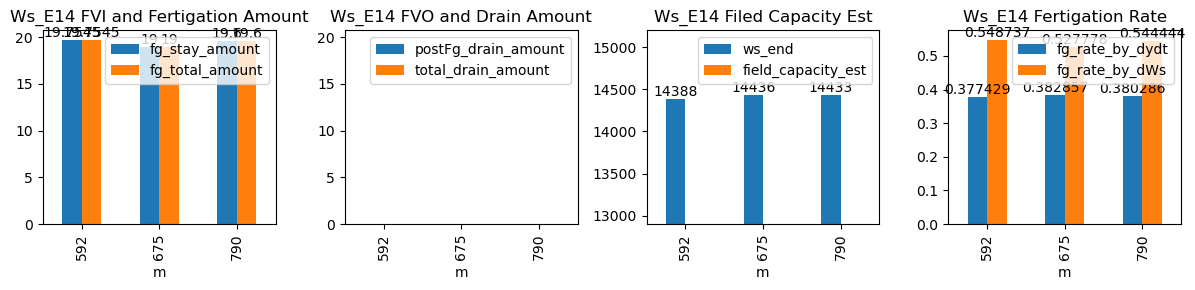
592 |
Ws_E14 |
0.263609 |
30 |
592.23 |
592.500000 |
592.83 |
593.833333 |
NaN |
NaN |
NaN |
14289.227273 |
14388.0 |
36 |
-0.062870 |
-0.023194 |
-0.031111 |
0.377429 |
0.548737 |
19.754545 |
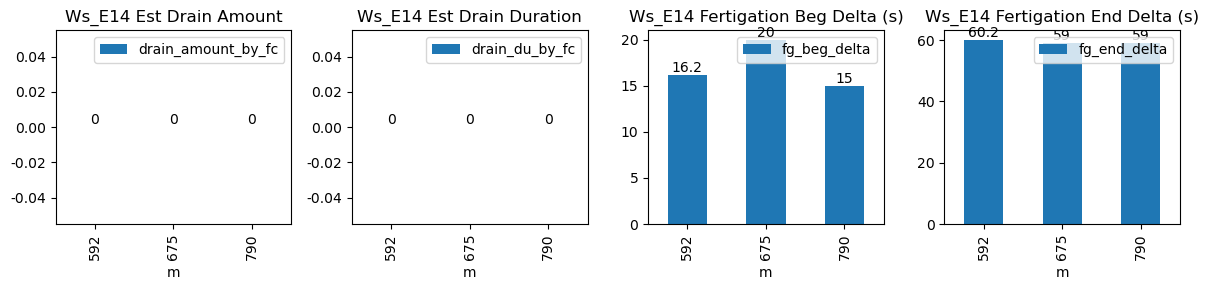
16.2 |
60.2 |
19.754545 |
0.0 |
-0.803512 |
NaN |
-0.803512 |
| 2025-12-16 11:15:00+08:00 |
71 |
675 |
Ws_E14 |
0.263609 |
30 |
675.00 |
675.333333 |
675.60 |
676.583333 |
NaN |
NaN |
NaN |
14341.000000 |
14436.0 |
36 |
-0.075910 |
-0.072778 |
-0.098000 |
0.382857 |
0.527778 |
19.000000 |
20.0 |
59.0 |
19.000000 |
0.0 |
-1.669435 |
NaN |
-1.669435 |
| 2025-12-16 13:10:00+08:00 |
71 |
790 |
Ws_E14 |
0.263609 |
30 |
790.00 |
790.250000 |
790.60 |
791.583333 |
NaN |
NaN |
NaN |
14335.000000 |
14433.0 |
36 |
-0.088506 |
-0.086111 |
-0.094906 |
0.380286 |
0.544444 |
19.600000 |
15.0 |
59.0 |
19.600000 |
0.0 |
-1.360414 |
NaN |
-1.360414 |