| 2025-12-15 09:25:00+08:00 |
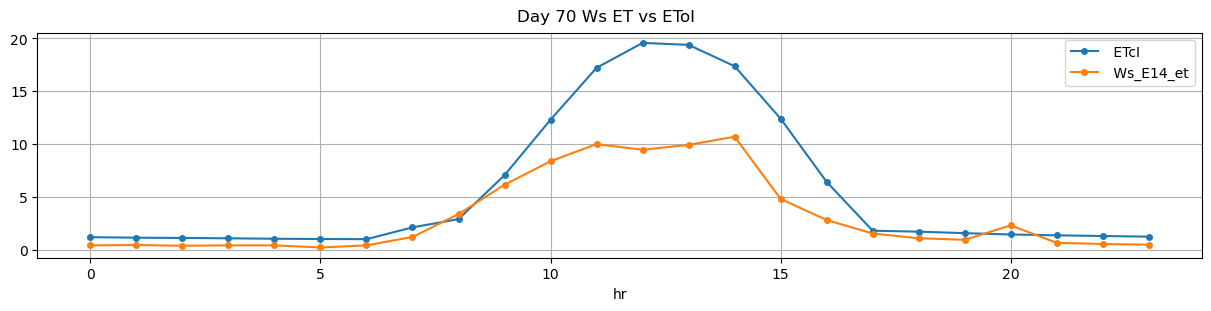
70 |
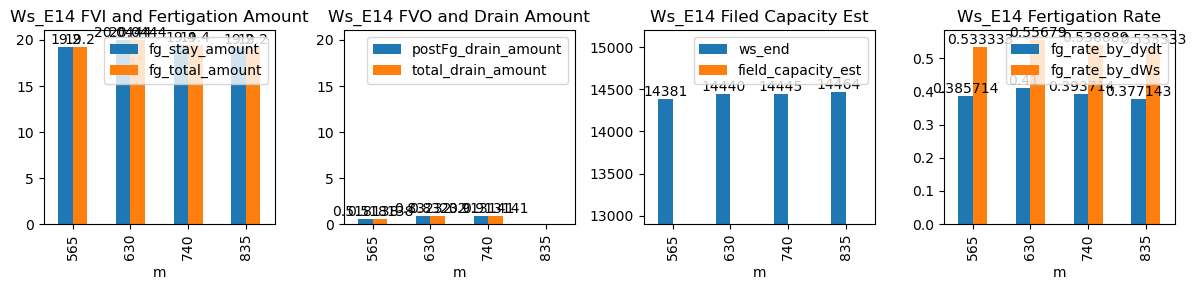
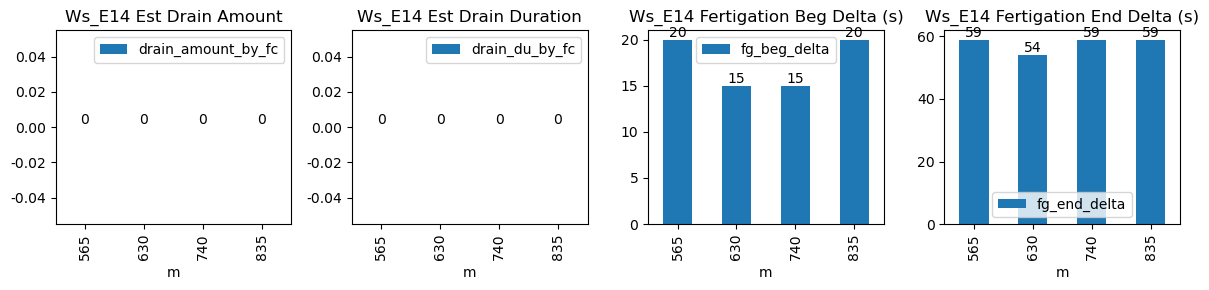
565 |
Ws_E14 |
0.250163 |
30 |
565.0 |
565.333333 |
565.6 |
566.583333 |
NaN |
NaN |
NaN |
14285.000000 |
14381.0 |
36 |
-0.039689 |
-0.088750 |
-0.056545 |
0.385714 |
0.533333 |
19.200000 |
20.0 |
59.0 |
19.200000 |
0.0 |
0.518138 |
NaN |
0.518138 |
| 2025-12-15 10:30:00+08:00 |
70 |
630 |
Ws_E14 |
0.250163 |
30 |
630.0 |
630.250000 |
630.6 |
631.500000 |
NaN |
NaN |
NaN |
14339.777778 |
14440.0 |
36 |
-0.046893 |
-0.069722 |
-0.072483 |
0.410000 |
0.556790 |
20.044444 |
15.0 |
54.0 |
20.044444 |
0.0 |
0.832320 |
NaN |
0.832320 |
| 2025-12-15 12:20:00+08:00 |
70 |
740 |
Ws_E14 |
0.250163 |
30 |
740.0 |
740.250000 |
740.6 |
741.583333 |
NaN |
NaN |
NaN |
14348.000000 |
14445.0 |
36 |
-0.055791 |
-0.060694 |
-0.070919 |
0.393714 |
0.538889 |
19.400000 |
15.0 |
59.0 |
19.400000 |
0.0 |
0.913141 |
NaN |
0.913141 |
| 2025-12-15 13:55:00+08:00 |
70 |
835 |
Ws_E14 |
0.250163 |
30 |
835.0 |
835.333333 |
835.6 |
836.583333 |
NaN |
NaN |
NaN |
14368.000000 |
14464.0 |
36 |
-0.071469 |
-0.084722 |
-0.088430 |
0.377143 |
0.533333 |
19.200000 |
20.0 |
59.0 |
19.200000 |
0.0 |
-0.880020 |
NaN |
-0.880020 |