| 2025-12-05 08:21:07+08:00 |
60 |
501 |
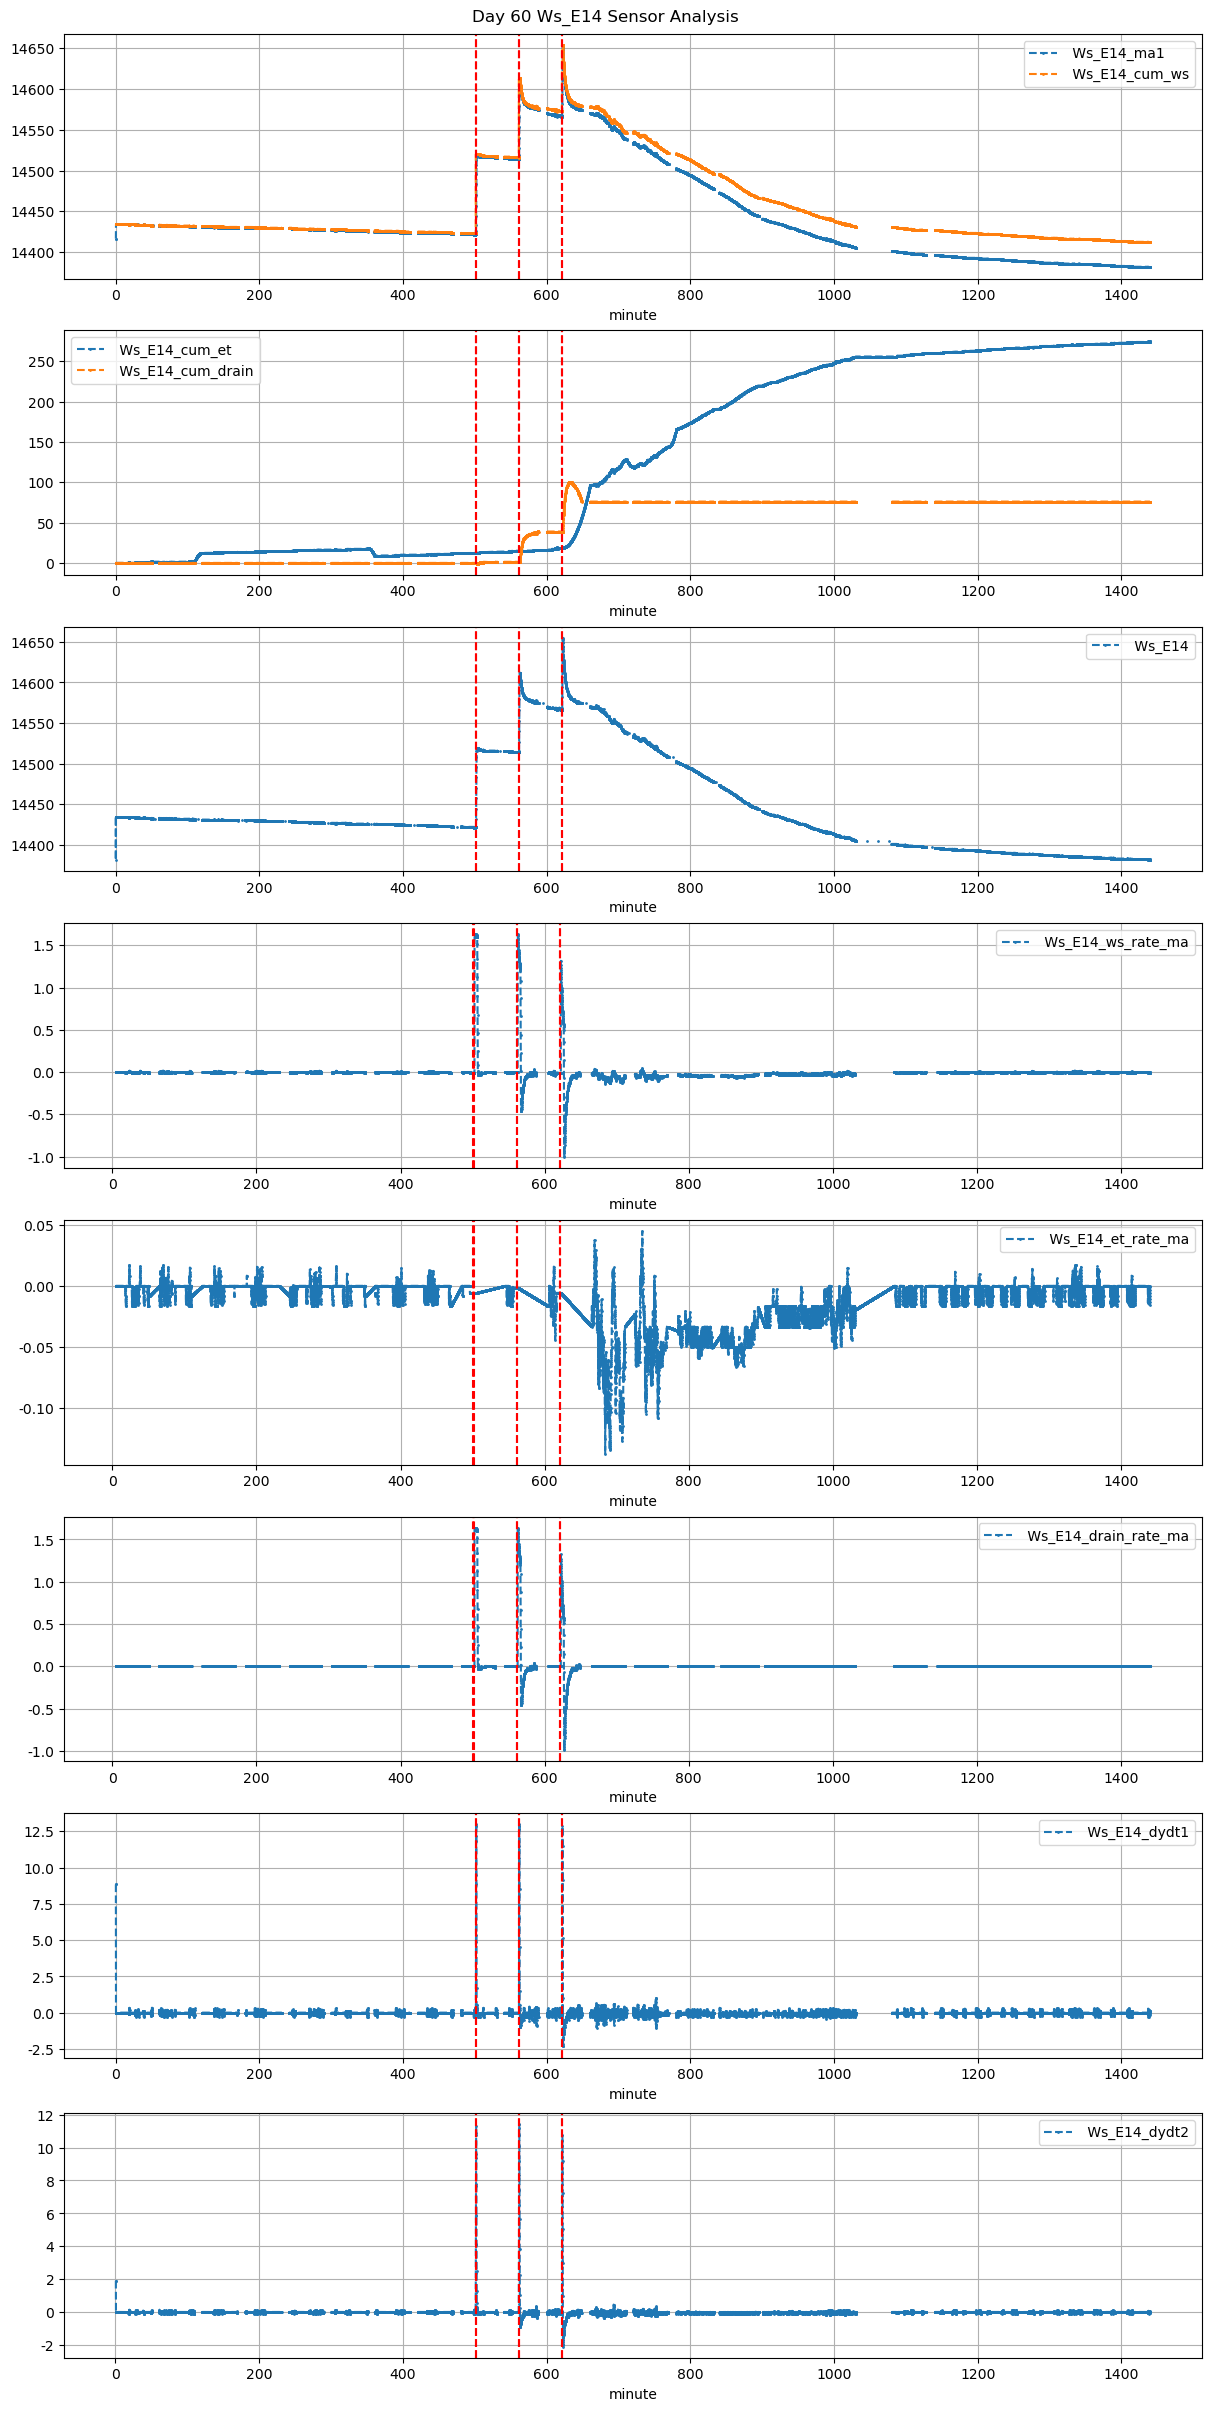
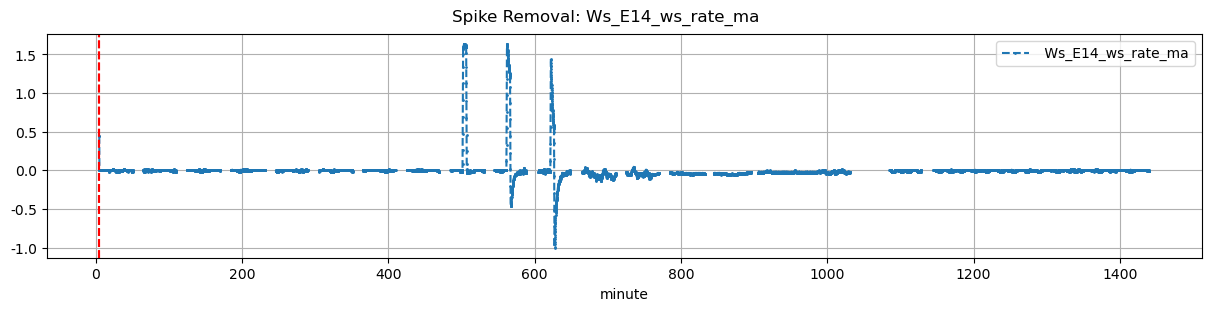
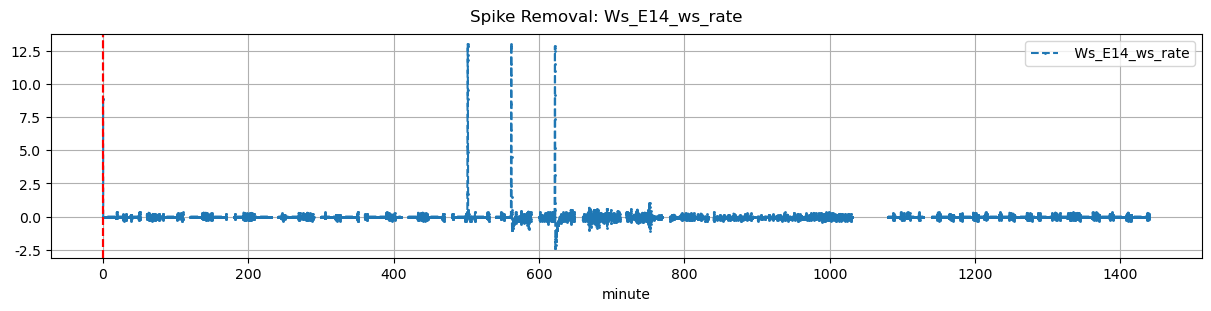
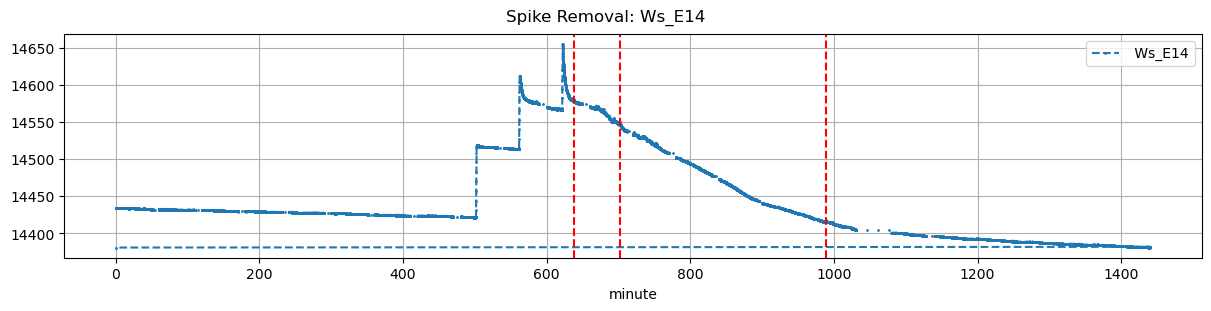
Ws_E14 |
0.436721 |
30 |
501.12 |
501.416667 |
501.72 |
502.666667 |
NaN |
NaN |
NaN |
14422.0 |
14519.0 |
36 |
-0.006111 |
-0.023056 |
NaN |
0.384286 |
0.538889 |
19.4 |
17.8 |
56.8 |
19.4 |
0.0 |
NaN |
NaN |
NaN |
| 2025-12-05 09:21:07+08:00 |
60 |
561 |
Ws_E14 |
0.436721 |
30 |
561.12 |
561.333333 |
561.72 |
562.583333 |
NaN |
NaN |
NaN |
14514.0 |
14612.0 |
36 |
-0.001481 |
-0.223333 |
NaN |
0.404286 |
0.544444 |
19.6 |
12.8 |
51.8 |
19.6 |
0.0 |
NaN |
NaN |
NaN |
| 2025-12-05 10:21:07+08:00 |
60 |
621 |
Ws_E14 |
0.436721 |
30 |
621.12 |
621.416667 |
621.72 |
622.500000 |
NaN |
NaN |
NaN |
14567.0 |
14648.0 |
36 |
-0.005750 |
-0.441111 |
NaN |
0.382286 |
0.450000 |
16.2 |
17.8 |
46.8 |
18.0 |
1.8 |
NaN |
NaN |
NaN |