| 2025-11-25 08:51:04+08:00 |
50 |
531 |
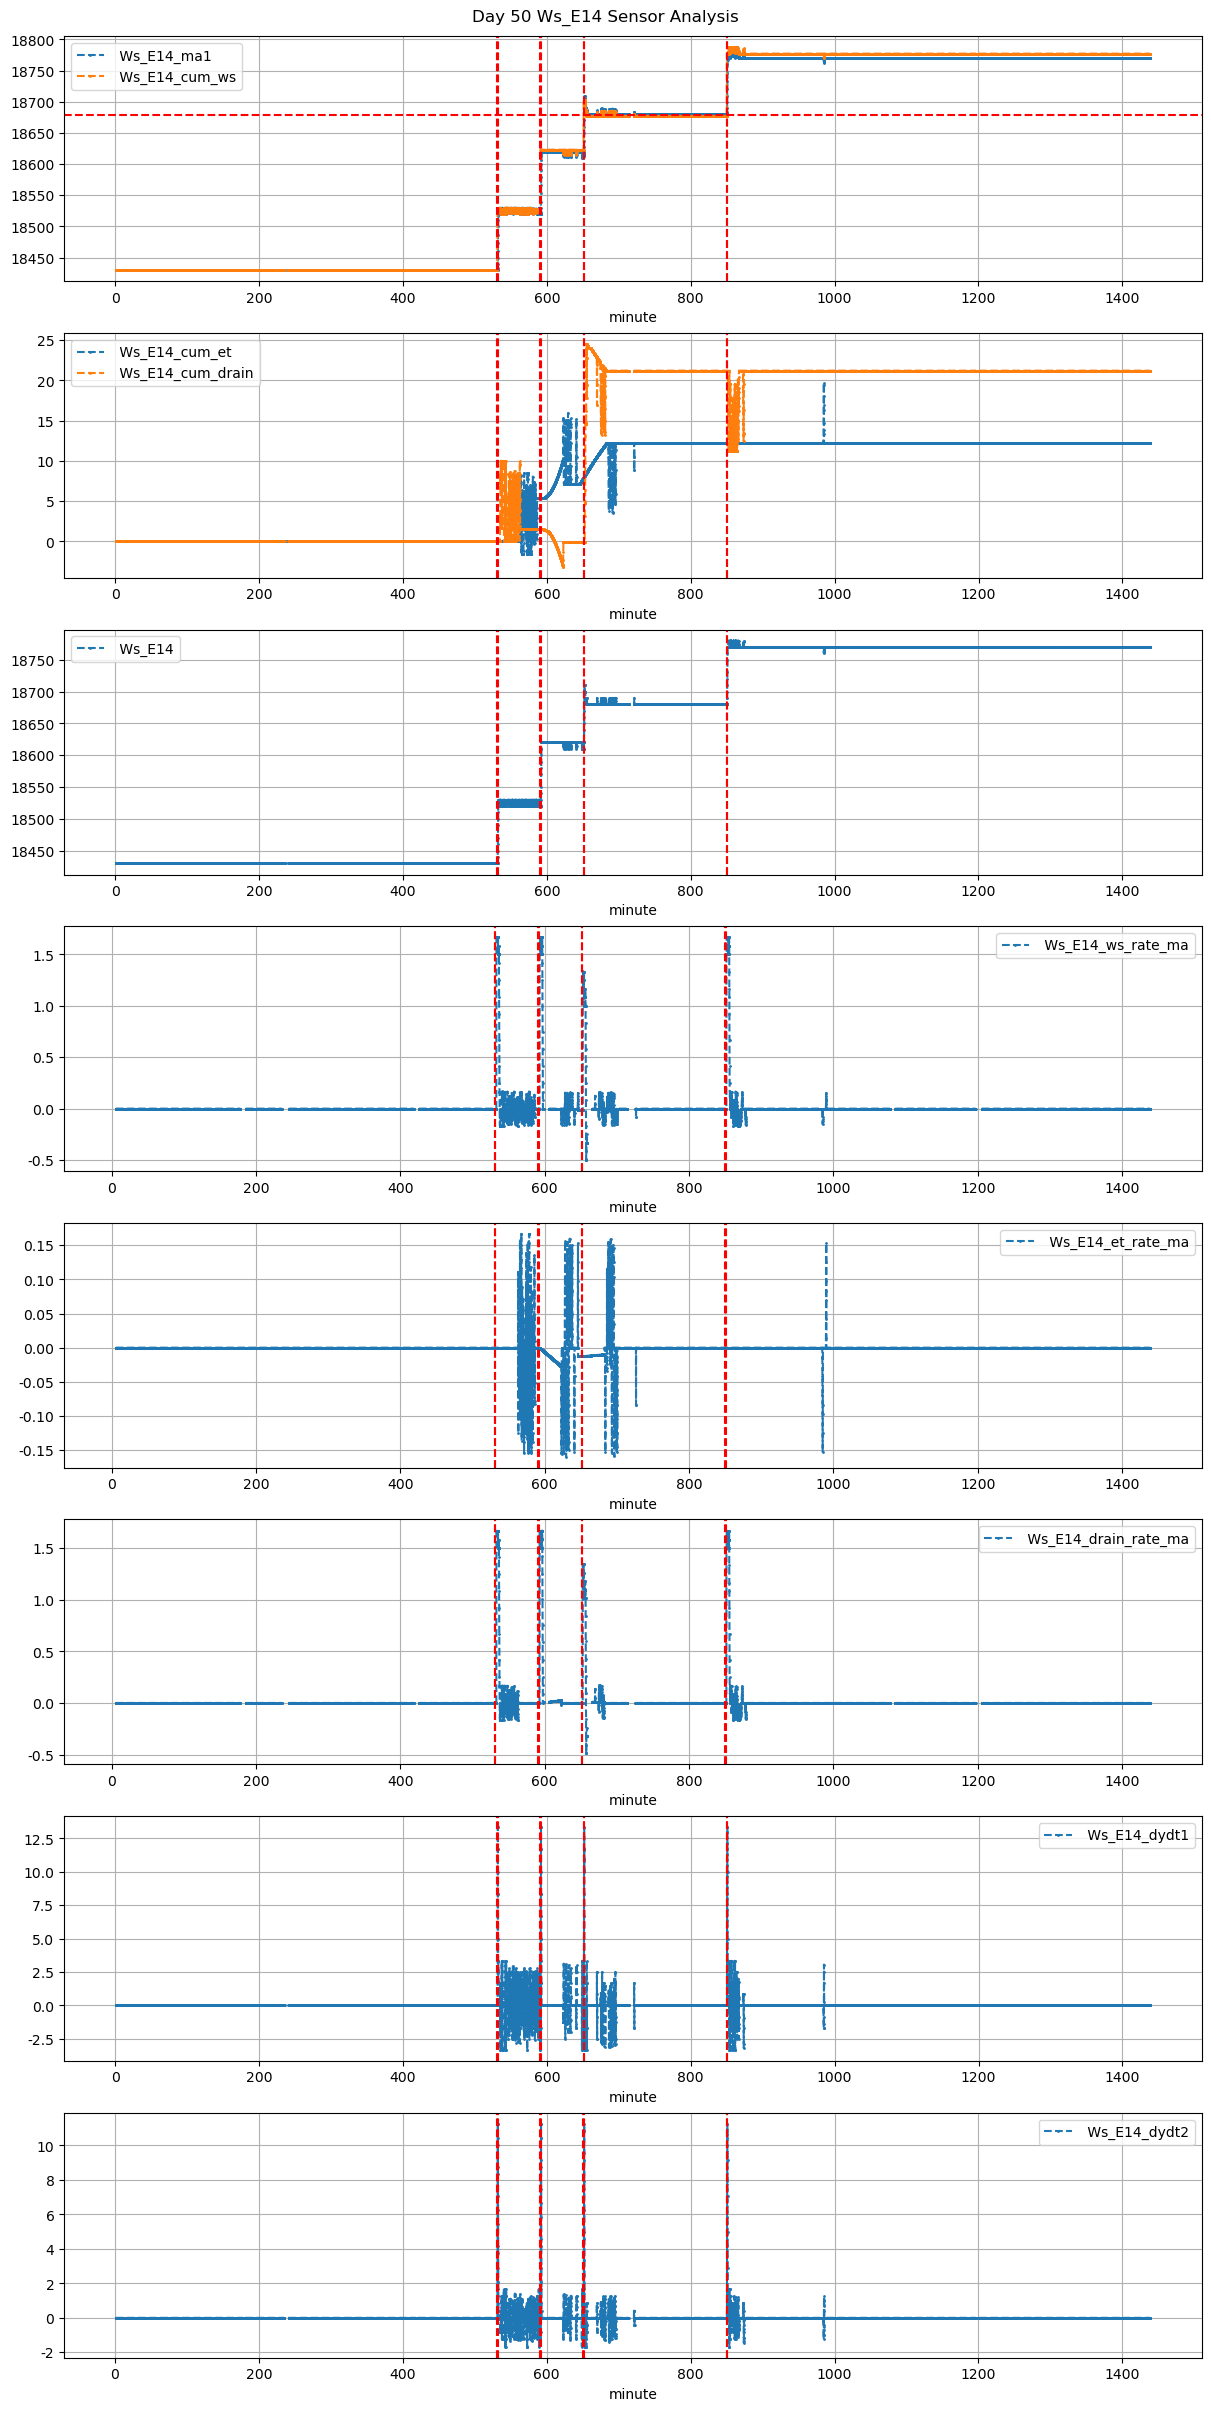
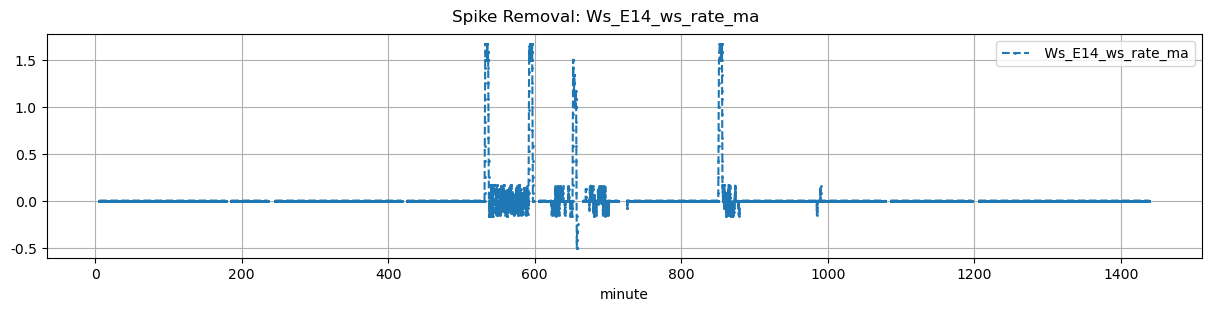
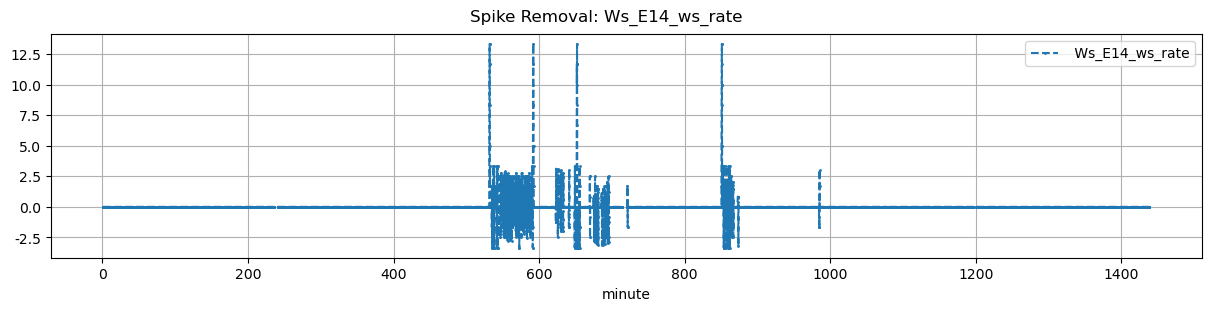
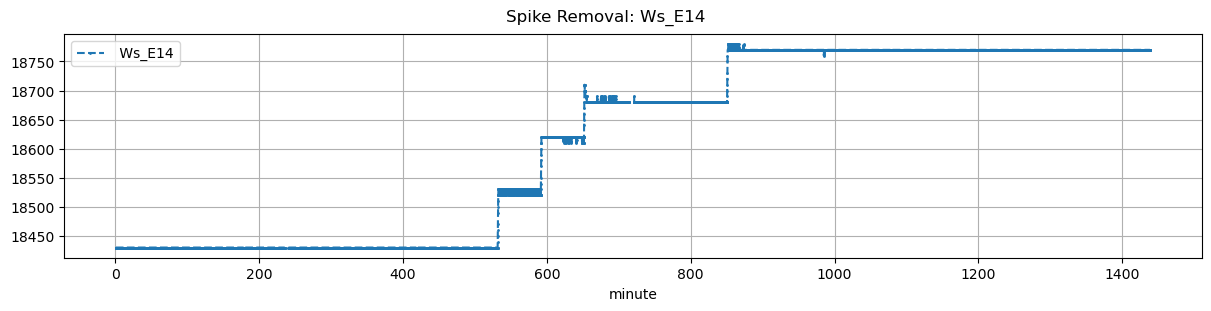
Ws_E14 |
1.975402 |
30 |
531.07 |
531.416667 |
531.64 |
532.916667 |
NaN |
NaN |
NaN |
18430.0 |
18530.0 |
34 |
0.000000 |
-0.005556 |
0.000000 |
0.370000 |
0.588235 |
20.0 |
20.8 |
76.6 |
20.0 |
0.0 |
0.600000 |
NaN |
0.600000 |
| 2025-11-25 09:51:04+08:00 |
50 |
591 |
Ws_E14 |
1.975402 |
30 |
591.07 |
591.500000 |
591.64 |
592.750000 |
NaN |
NaN |
NaN |
18520.0 |
18620.0 |
34 |
-0.023016 |
0.000000 |
-0.027431 |
0.416667 |
0.588235 |
20.0 |
25.8 |
66.6 |
20.0 |
0.0 |
-0.886714 |
NaN |
-0.886714 |
| 2025-11-25 10:51:04+08:00 |
50 |
651 |
Ws_E14 |
1.975402 |
30 |
651.07 |
651.416667 |
651.64 |
652.583333 |
NaN |
NaN |
NaN |
18620.0 |
18700.0 |
34 |
-0.012500 |
-0.333333 |
-0.009722 |
0.393333 |
0.470588 |
16.0 |
20.8 |
56.6 |
17.0 |
1.0 |
4.288280 |
18678.558599 |
5.288280 |
| 2025-11-25 14:10:00+08:00 |
50 |
850 |
Ws_E14 |
1.975402 |
30 |
850.00 |
850.416667 |
850.57 |
851.666667 |
NaN |
NaN |
NaN |
18680.0 |
18780.0 |
34 |
0.000000 |
0.000000 |
0.000000 |
0.383333 |
0.588235 |
20.0 |
25.0 |
65.8 |
20.0 |
0.0 |
0.000000 |
NaN |
0.000000 |