| 2025-11-26 08:45:00+08:00 |
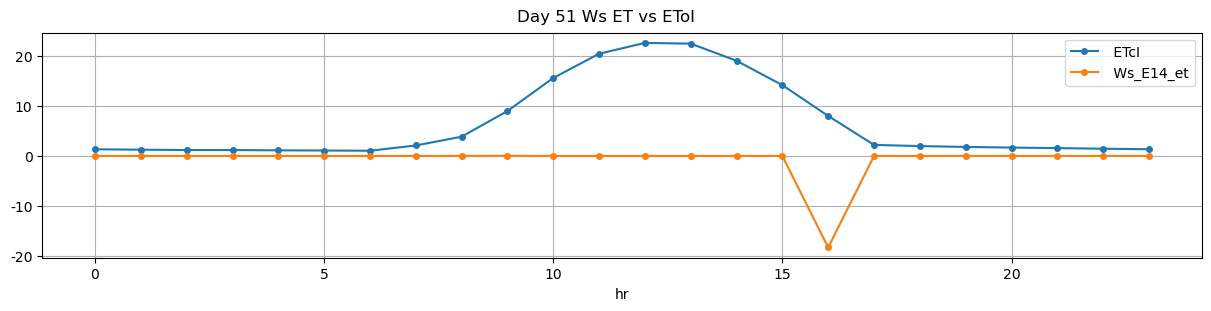
51 |
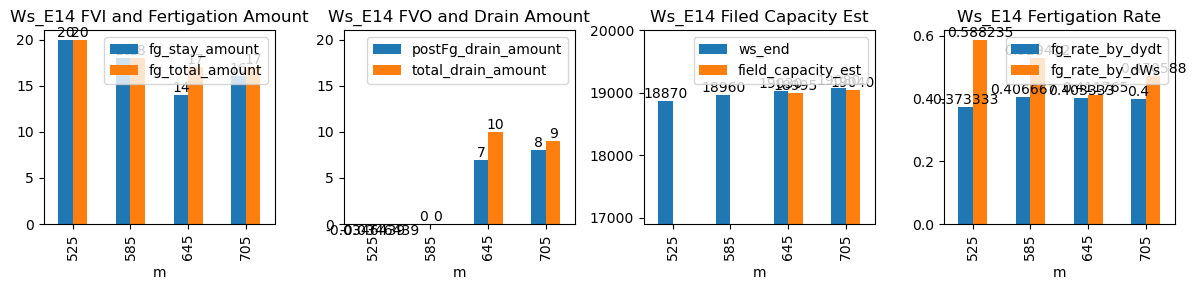
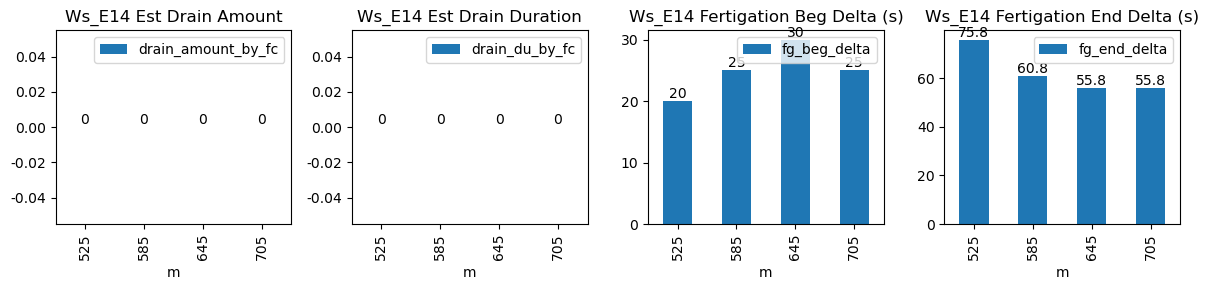
525 |
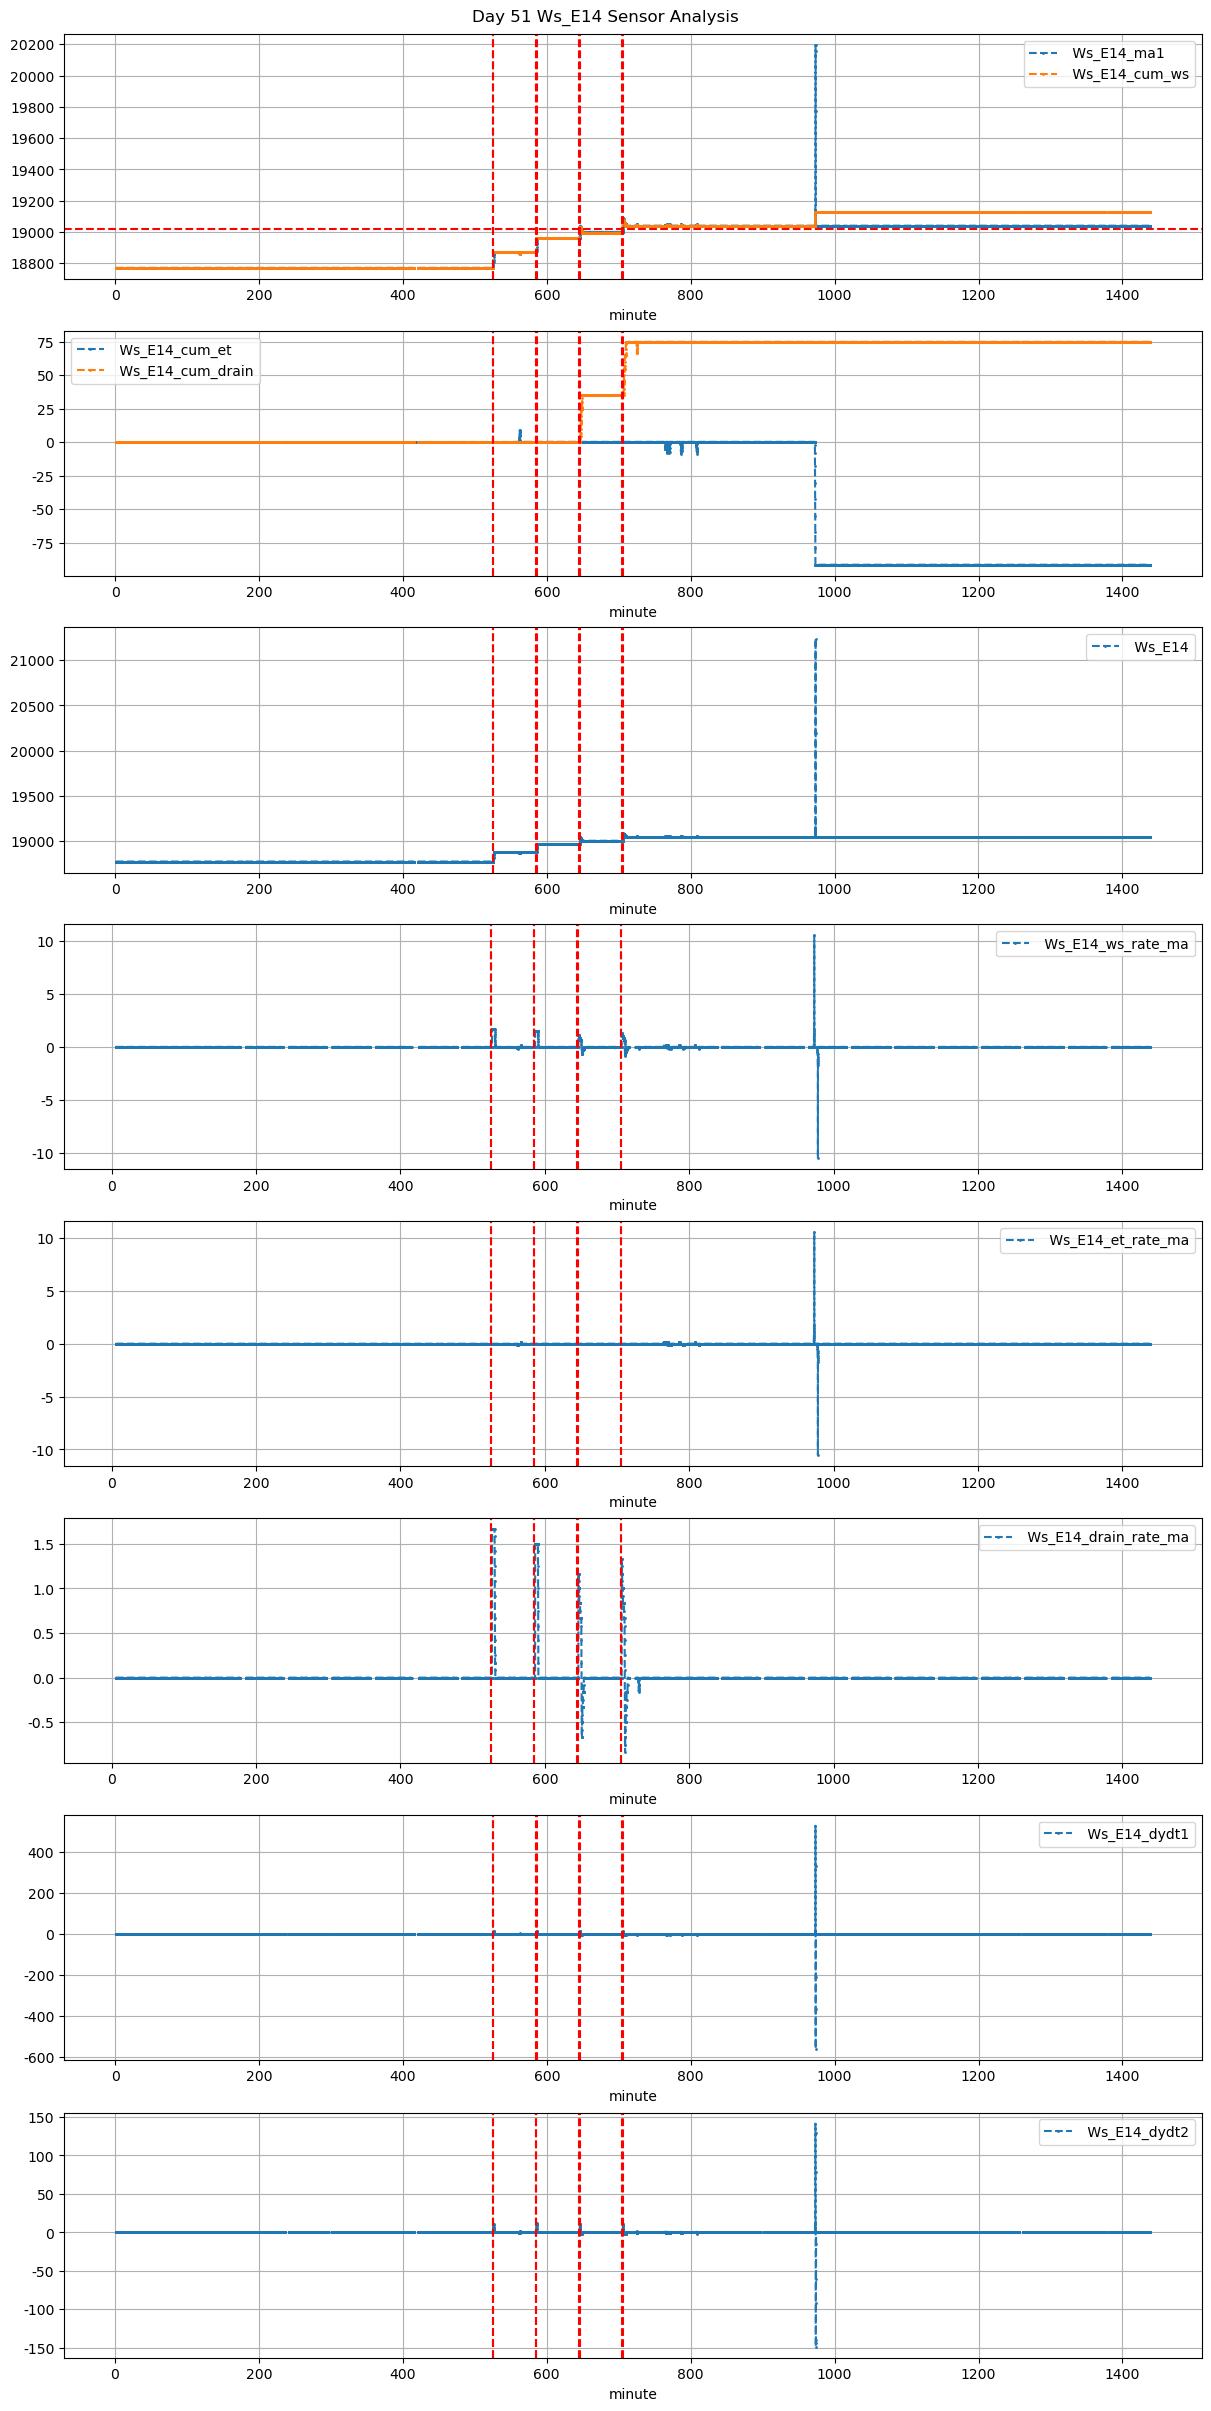
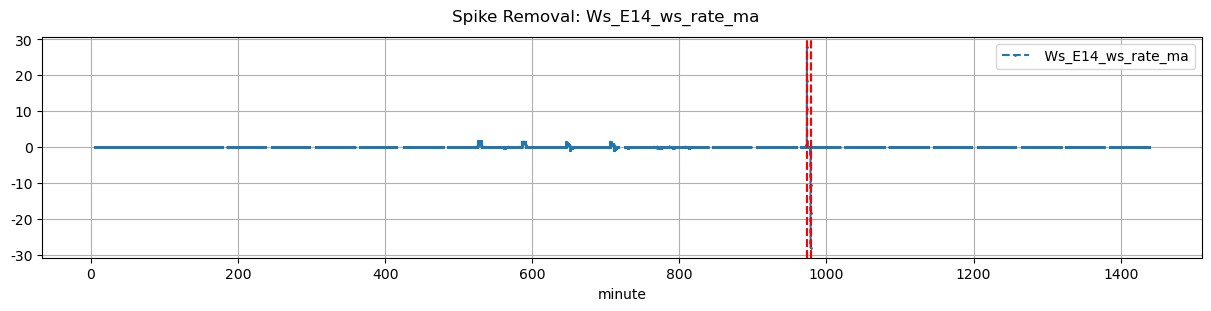
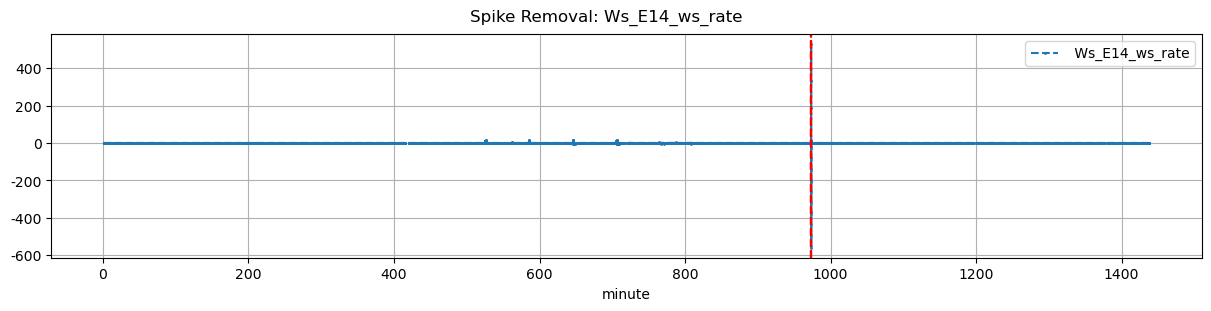
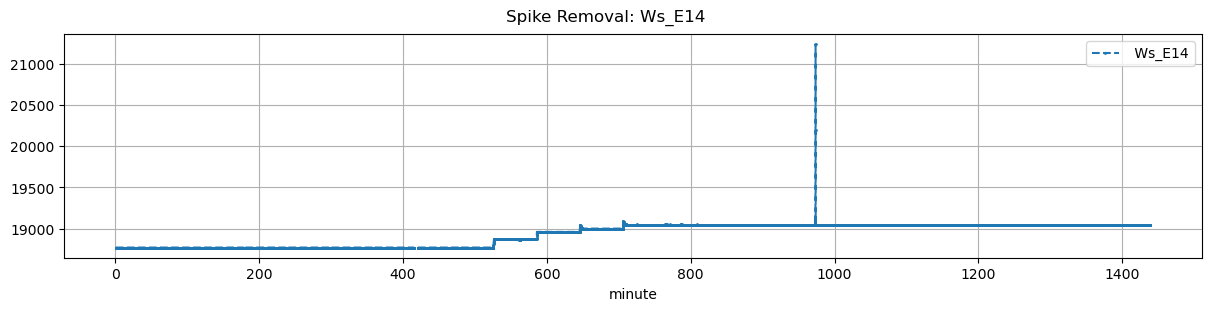
Ws_E14 |
114.653003 |
30 |
525.0 |
525.333333 |
525.57 |
526.833333 |
NaN |
NaN |
NaN |
18770.0 |
18870.0 |
34 |
0.0 |
0.000000 |
-0.001042 |
0.373333 |
0.588235 |
20.0 |
20.0 |
75.8 |
20.0 |
0.0 |
-0.034644 |
NaN |
-0.034644 |
| 2025-11-26 09:45:00+08:00 |
51 |
585 |
Ws_E14 |
114.653003 |
30 |
585.0 |
585.416667 |
585.57 |
586.583333 |
NaN |
NaN |
NaN |
18870.0 |
18960.0 |
34 |
0.0 |
0.000000 |
0.000000 |
0.406667 |
0.529412 |
18.0 |
25.0 |
60.8 |
18.0 |
0.0 |
0.000000 |
NaN |
0.000000 |
| 2025-11-26 10:45:00+08:00 |
51 |
645 |
Ws_E14 |
114.653003 |
30 |
645.0 |
645.500000 |
645.57 |
646.500000 |
NaN |
NaN |
NaN |
18960.0 |
19030.0 |
34 |
0.0 |
-0.147222 |
0.000000 |
0.403333 |
0.411765 |
14.0 |
30.0 |
55.8 |
17.0 |
3.0 |
7.000000 |
18995.0 |
10.000000 |
| 2025-11-26 11:45:00+08:00 |
51 |
705 |
Ws_E14 |
114.653003 |
30 |
705.0 |
705.416667 |
705.57 |
706.500000 |
NaN |
NaN |
NaN |
19000.0 |
19080.0 |
34 |
0.0 |
-0.202778 |
0.000000 |
0.400000 |
0.470588 |
16.0 |
25.0 |
55.8 |
17.0 |
1.0 |
8.000000 |
19040.0 |
9.000000 |