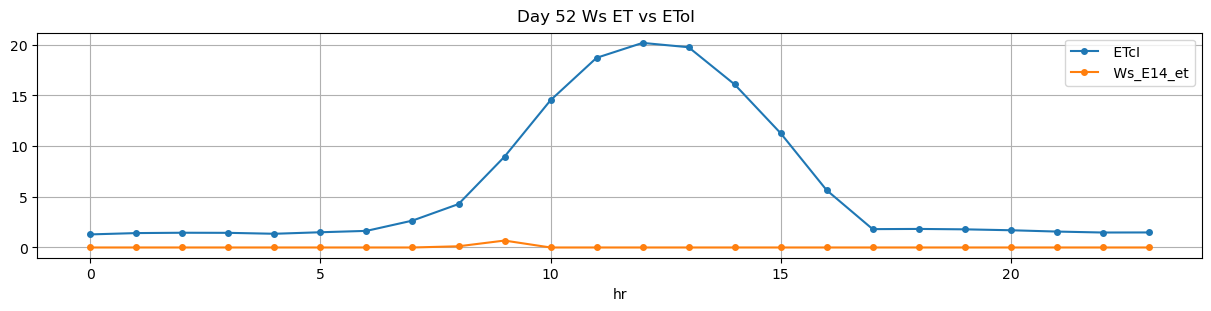
| 2025-11-27 08:50:00+08:00 |
52 |
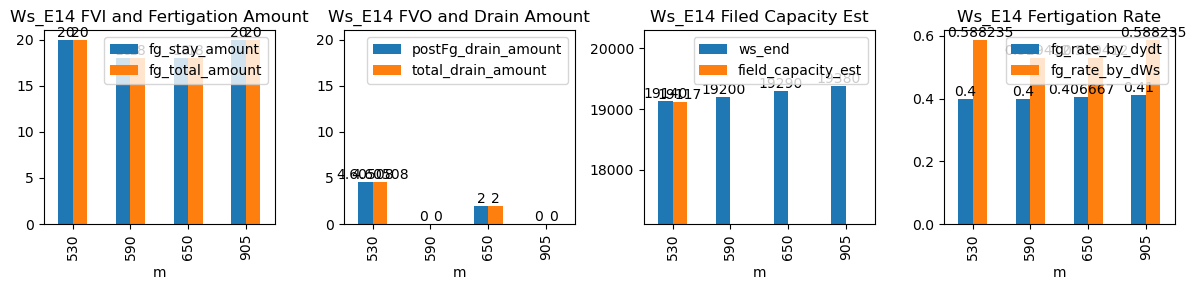
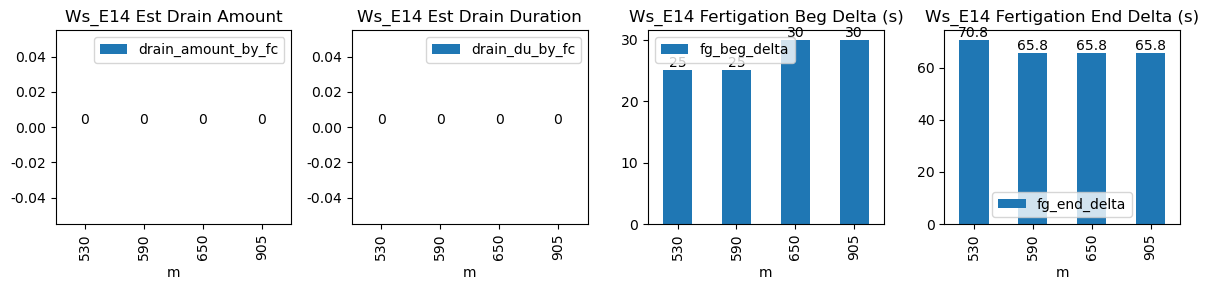
530 |
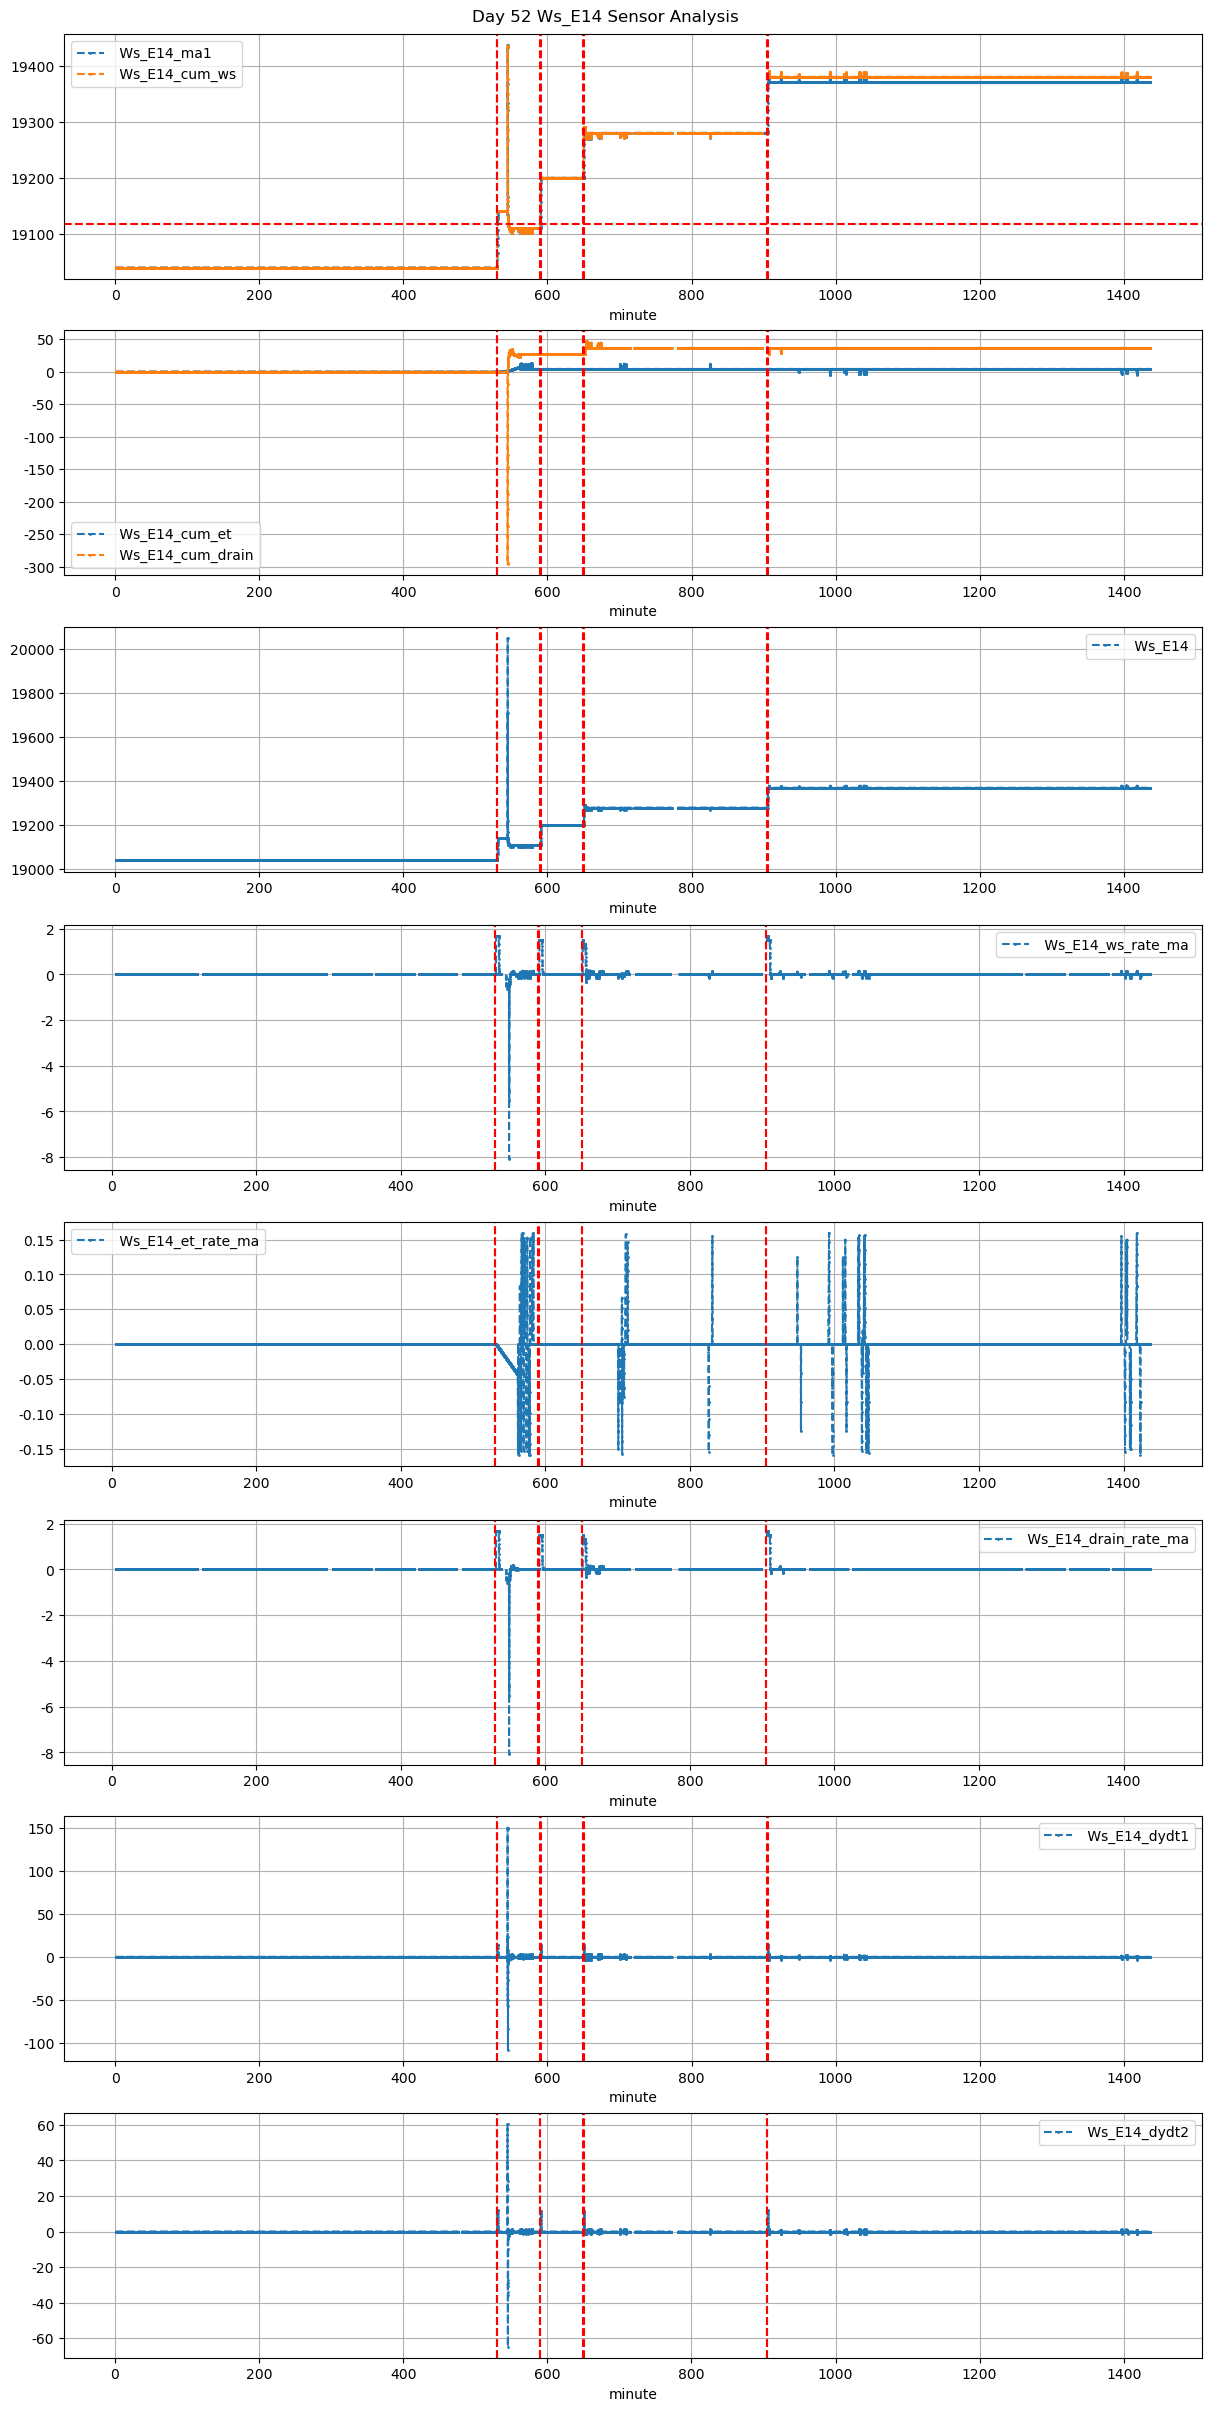
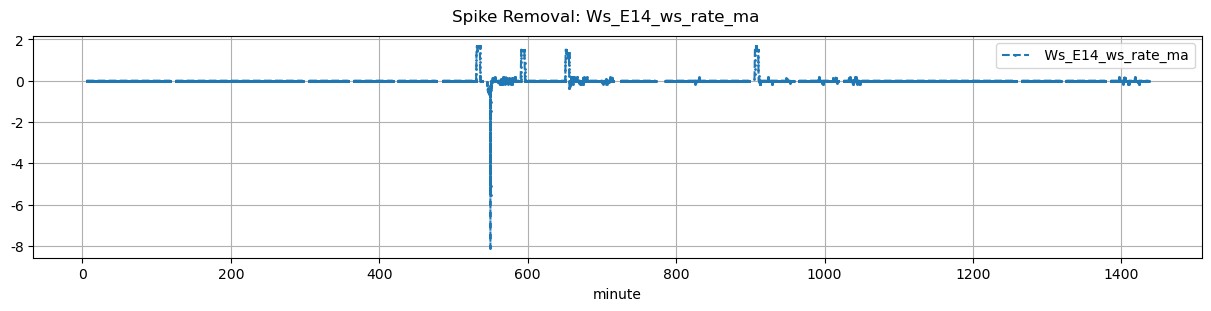
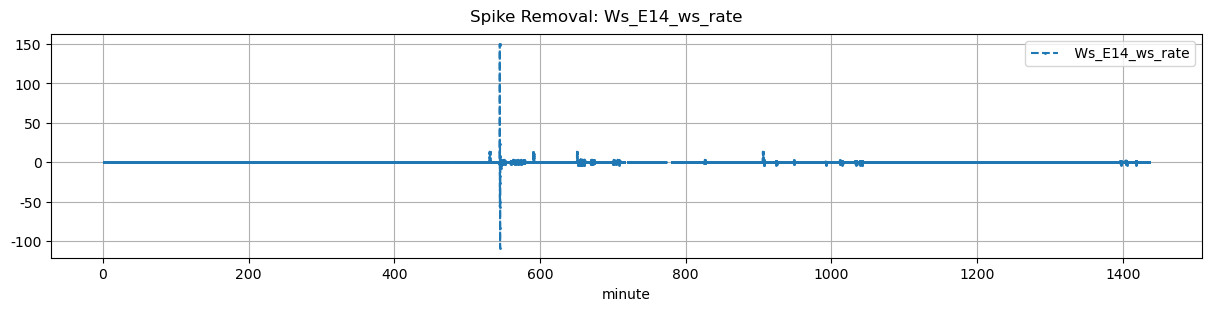
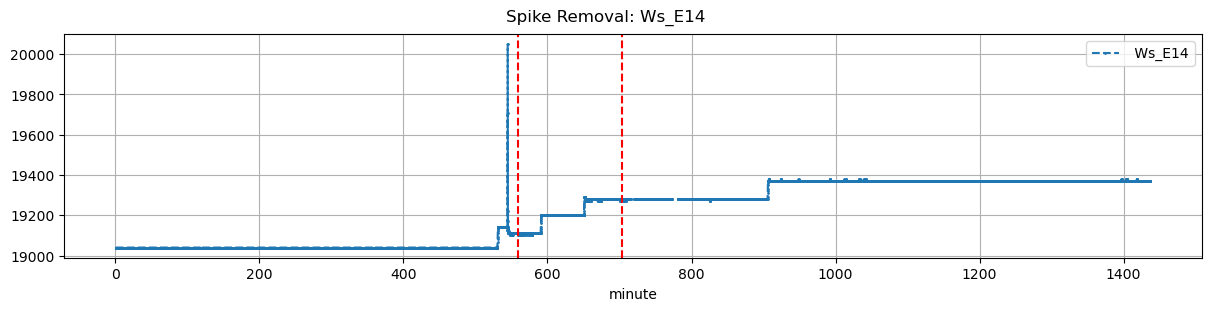
Ws_E14 |
26.1802 |
30 |
530.0 |
530.416667 |
530.57 |
531.750000 |
NaN |
NaN |
NaN |
19040.0 |
19140.0 |
34 |
0.0 |
0.000000 |
-0.043673 |
0.400000 |
0.588235 |
20.0 |
25.0 |
70.8 |
20.0 |
0.0 |
4.605082 |
19116.974589 |
4.605082 |
| 2025-11-27 09:50:00+08:00 |
52 |
590 |
Ws_E14 |
26.1802 |
30 |
590.0 |
590.416667 |
590.57 |
591.666667 |
NaN |
NaN |
NaN |
19110.0 |
19200.0 |
34 |
0.0 |
0.000000 |
0.000000 |
0.400000 |
0.529412 |
18.0 |
25.0 |
65.8 |
18.0 |
0.0 |
0.000000 |
NaN |
0.000000 |
| 2025-11-27 10:50:00+08:00 |
52 |
650 |
Ws_E14 |
26.1802 |
30 |
650.0 |
650.500000 |
650.57 |
651.666667 |
NaN |
NaN |
NaN |
19200.0 |
19290.0 |
34 |
0.0 |
0.000000 |
0.000000 |
0.406667 |
0.529412 |
18.0 |
30.0 |
65.8 |
18.0 |
0.0 |
2.000000 |
NaN |
2.000000 |
| 2025-11-27 15:05:00+08:00 |
52 |
905 |
Ws_E14 |
26.1802 |
30 |
905.0 |
905.500000 |
905.57 |
906.666667 |
NaN |
NaN |
NaN |
19280.0 |
19380.0 |
34 |
NaN |
-0.016667 |
0.000000 |
0.410000 |
0.588235 |
20.0 |
30.0 |
65.8 |
20.0 |
0.0 |
NaN |
NaN |
NaN |