| 2025-11-28 09:00:00+08:00 |
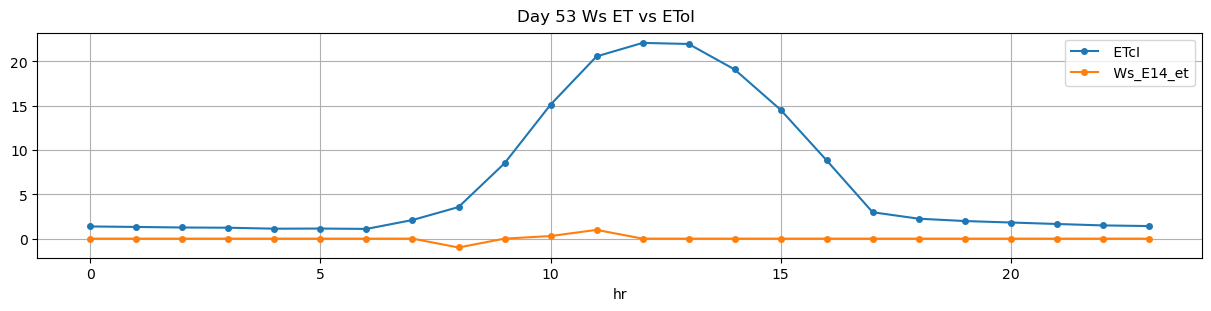
53 |
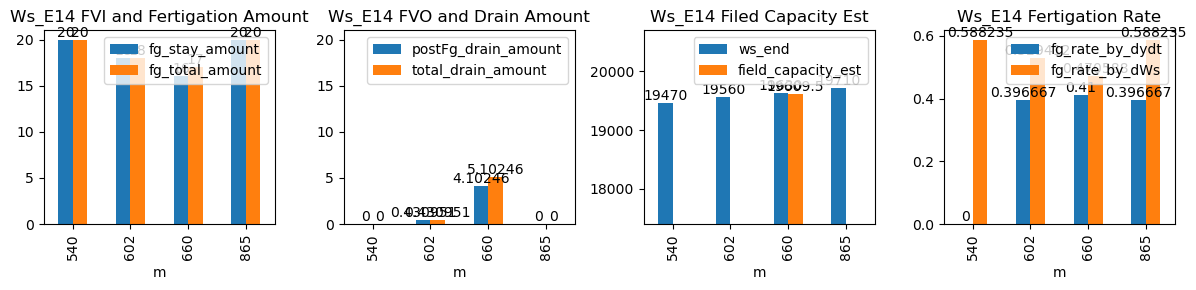
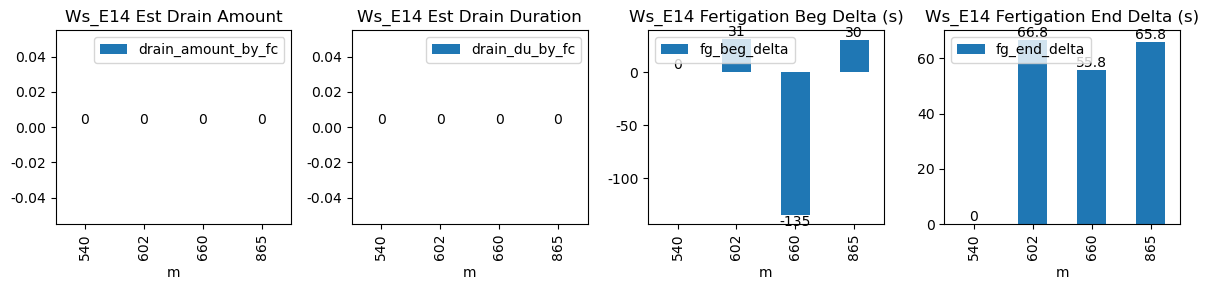
540 |
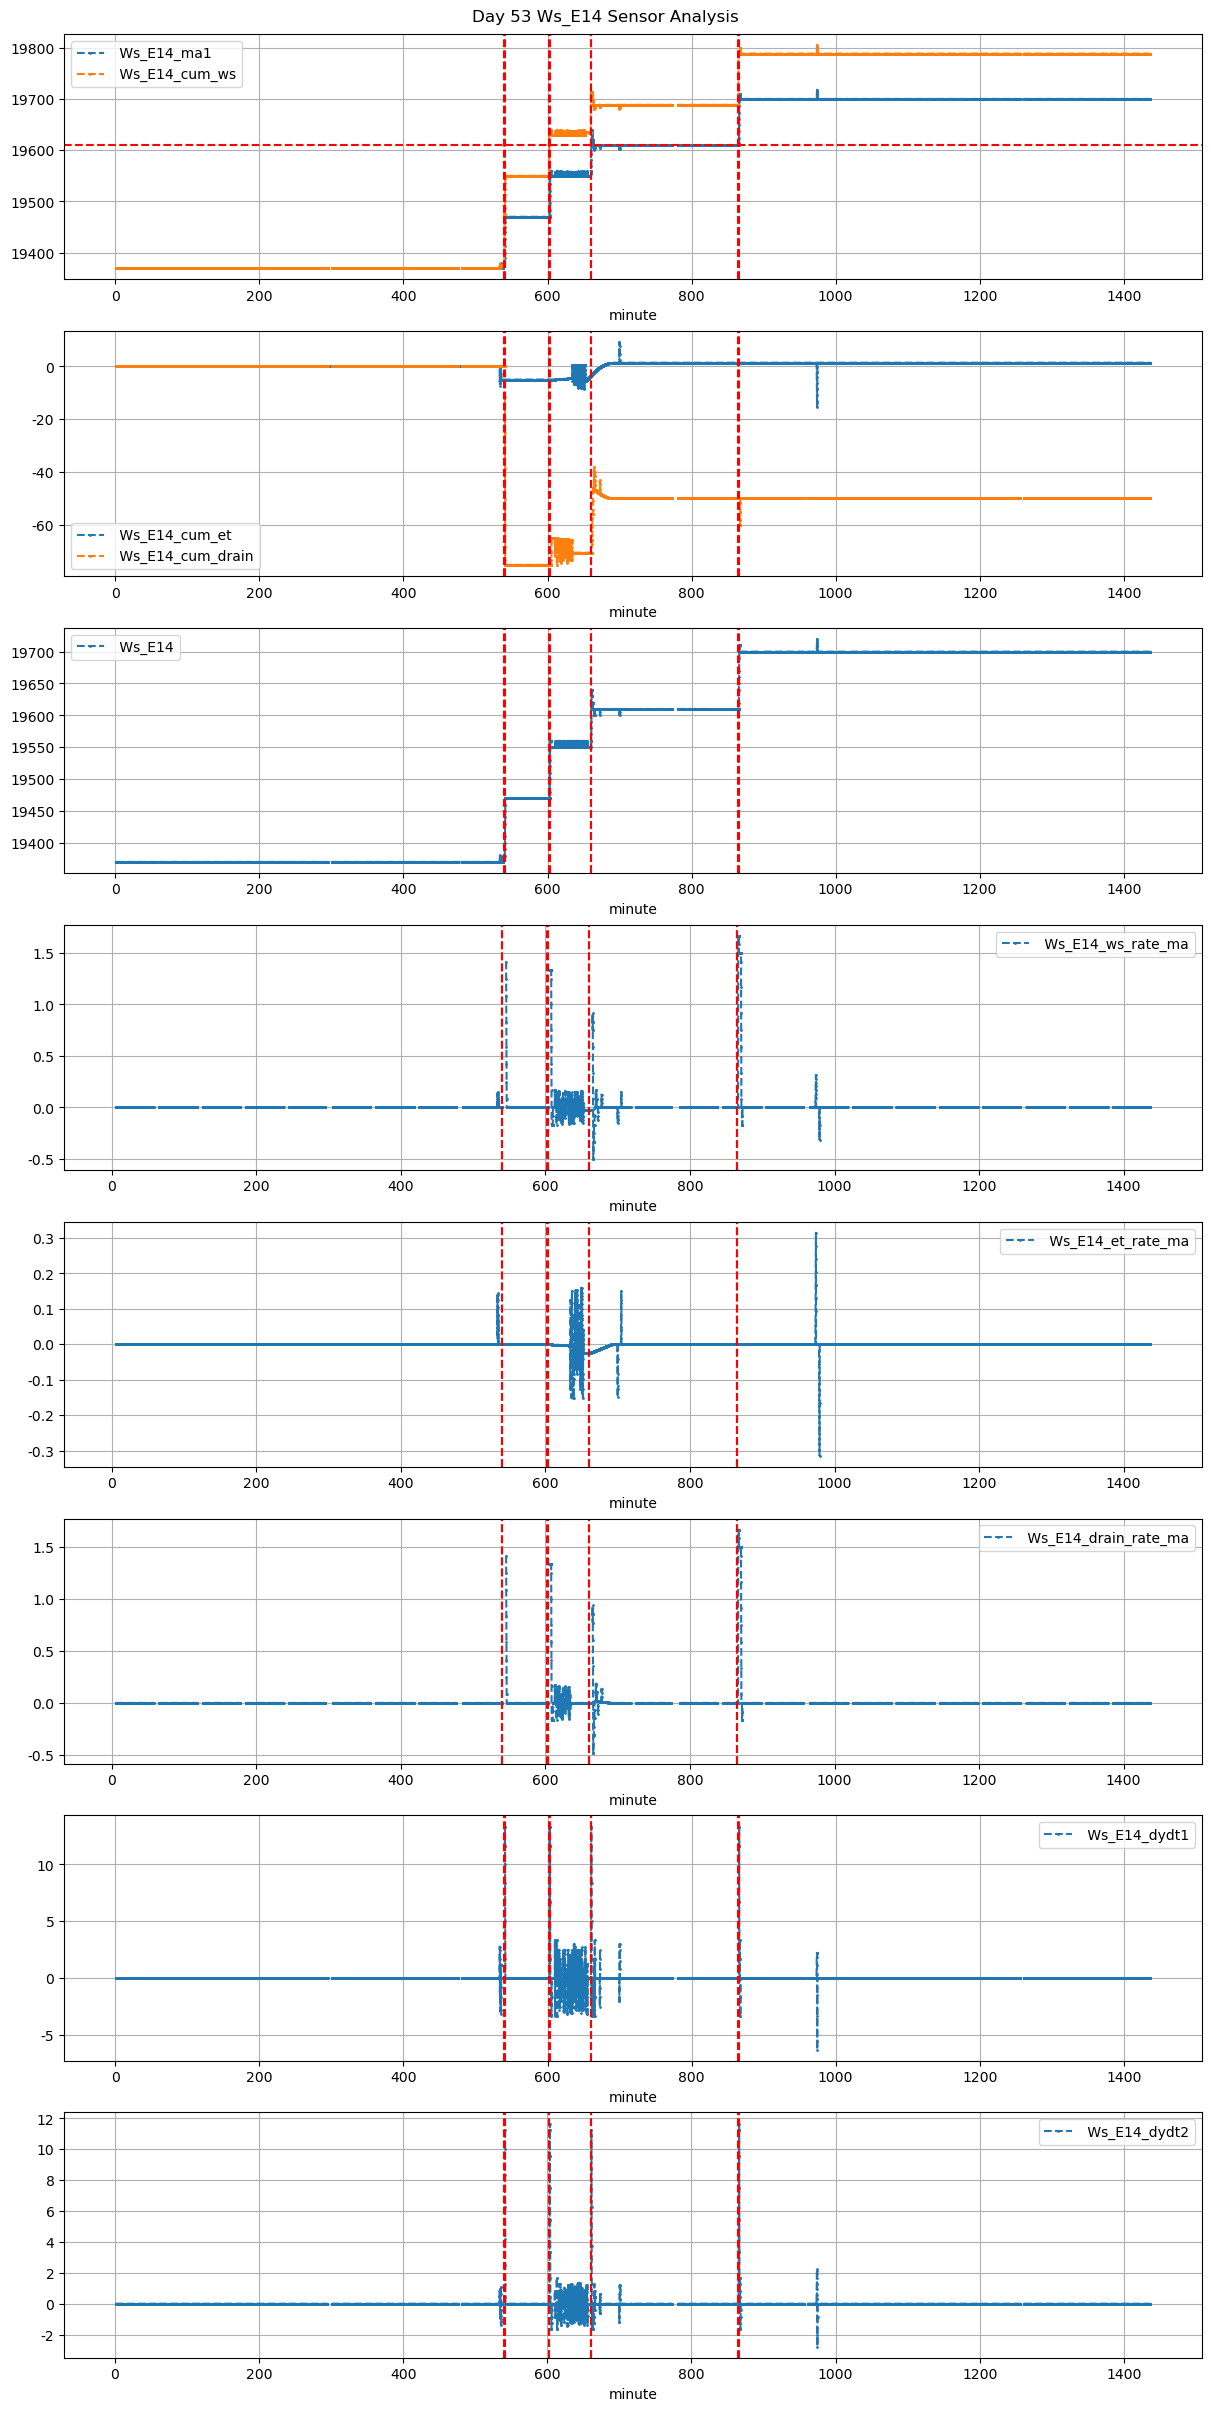
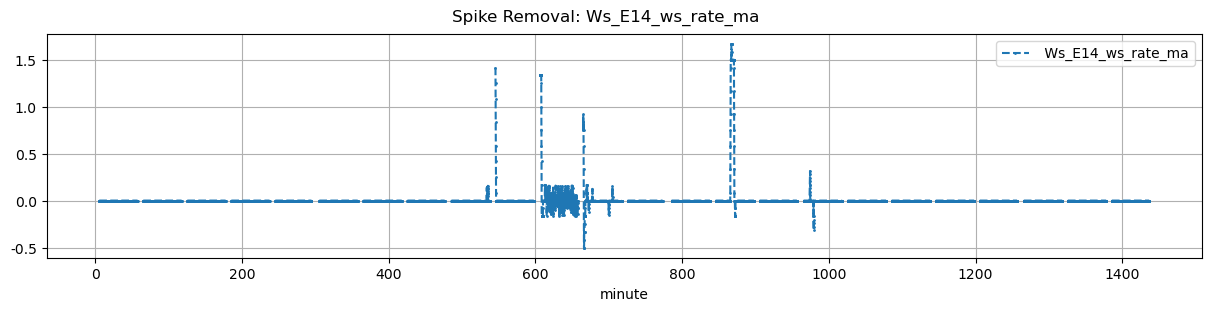
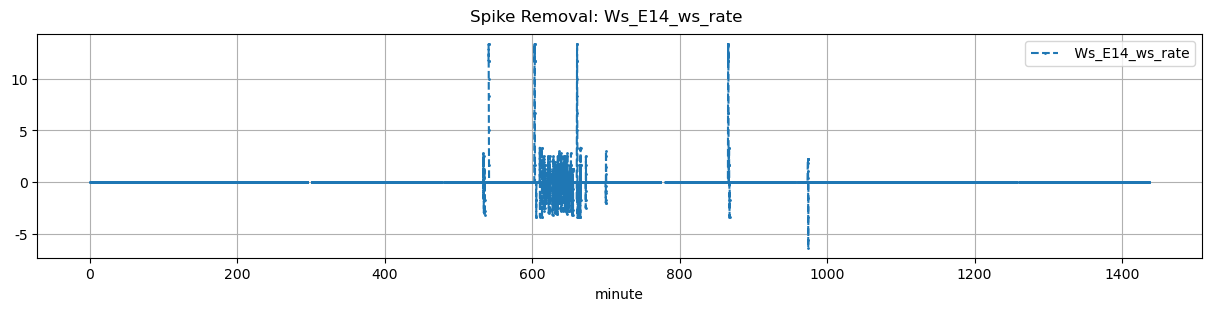
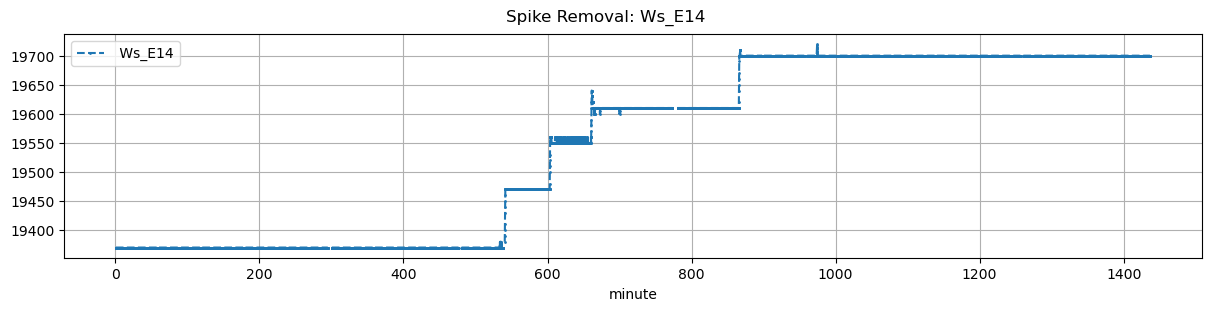
Ws_E14 |
2.264875 |
30 |
540.0 |
NaN |
540.57 |
NaN |
NaN |
NaN |
NaN |
19370.0 |
19470.0 |
34 |
0.000000 |
0.000000 |
0.000000 |
NaN |
0.588235 |
20.0 |
NaN |
NaN |
20.0 |
0.0 |
NaN |
NaN |
NaN |
| 2025-11-28 10:02:24+08:00 |
53 |
602 |
Ws_E14 |
2.264875 |
30 |
602.4 |
602.916667 |
602.97 |
604.083333 |
NaN |
NaN |
NaN |
19470.0 |
19560.0 |
34 |
0.000000 |
-0.029167 |
-0.003704 |
0.396667 |
0.529412 |
18.0 |
31.0 |
66.8 |
18.0 |
0.0 |
0.430951 |
NaN |
0.430951 |
| 2025-11-28 11:00:00+08:00 |
53 |
660 |
Ws_E14 |
2.264875 |
30 |
660.0 |
657.750000 |
660.57 |
661.500000 |
NaN |
NaN |
NaN |
19550.0 |
19630.0 |
34 |
-0.024953 |
-0.059722 |
0.000000 |
0.410000 |
0.470588 |
16.0 |
-135.0 |
55.8 |
17.0 |
1.0 |
4.102455 |
19609.487724 |
5.102455 |
| 2025-11-28 14:25:00+08:00 |
53 |
865 |
Ws_E14 |
2.264875 |
30 |
865.0 |
865.500000 |
865.57 |
866.666667 |
NaN |
NaN |
NaN |
19610.0 |
19710.0 |
34 |
0.000000 |
-0.022222 |
0.000000 |
0.396667 |
0.588235 |
20.0 |
30.0 |
65.8 |
20.0 |
0.0 |
0.000000 |
NaN |
0.000000 |