| 2025-11-29 08:50:00+08:00 |
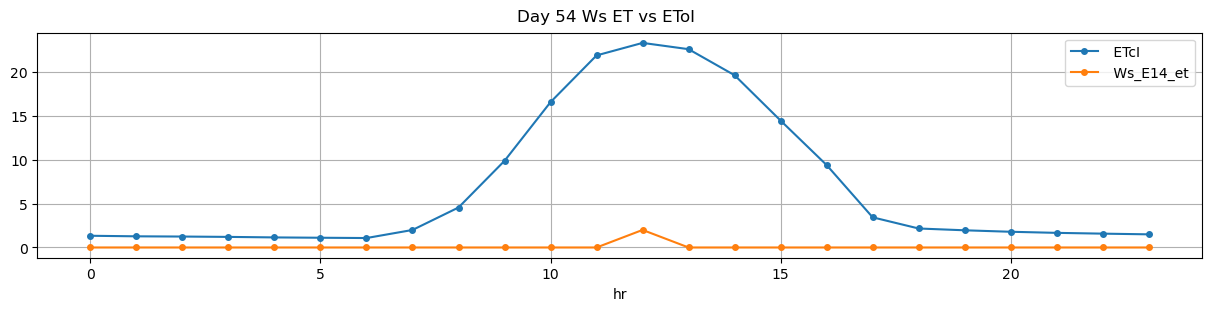
54 |
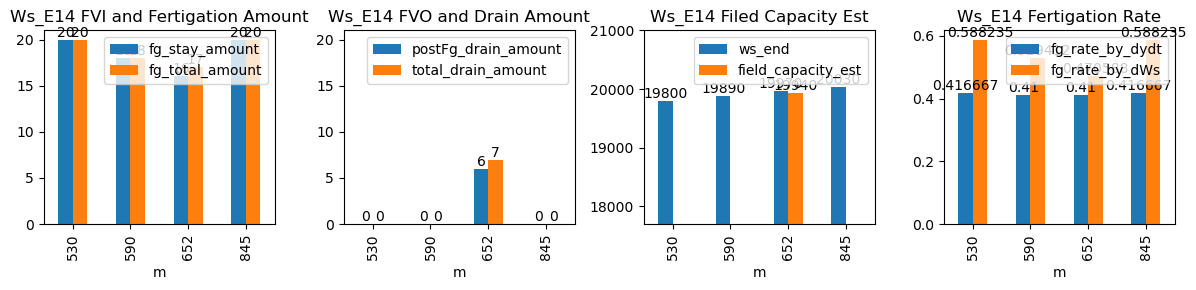
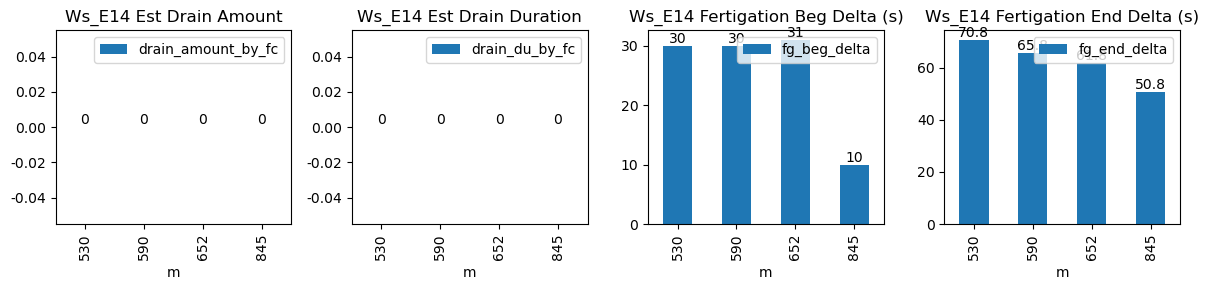
530 |
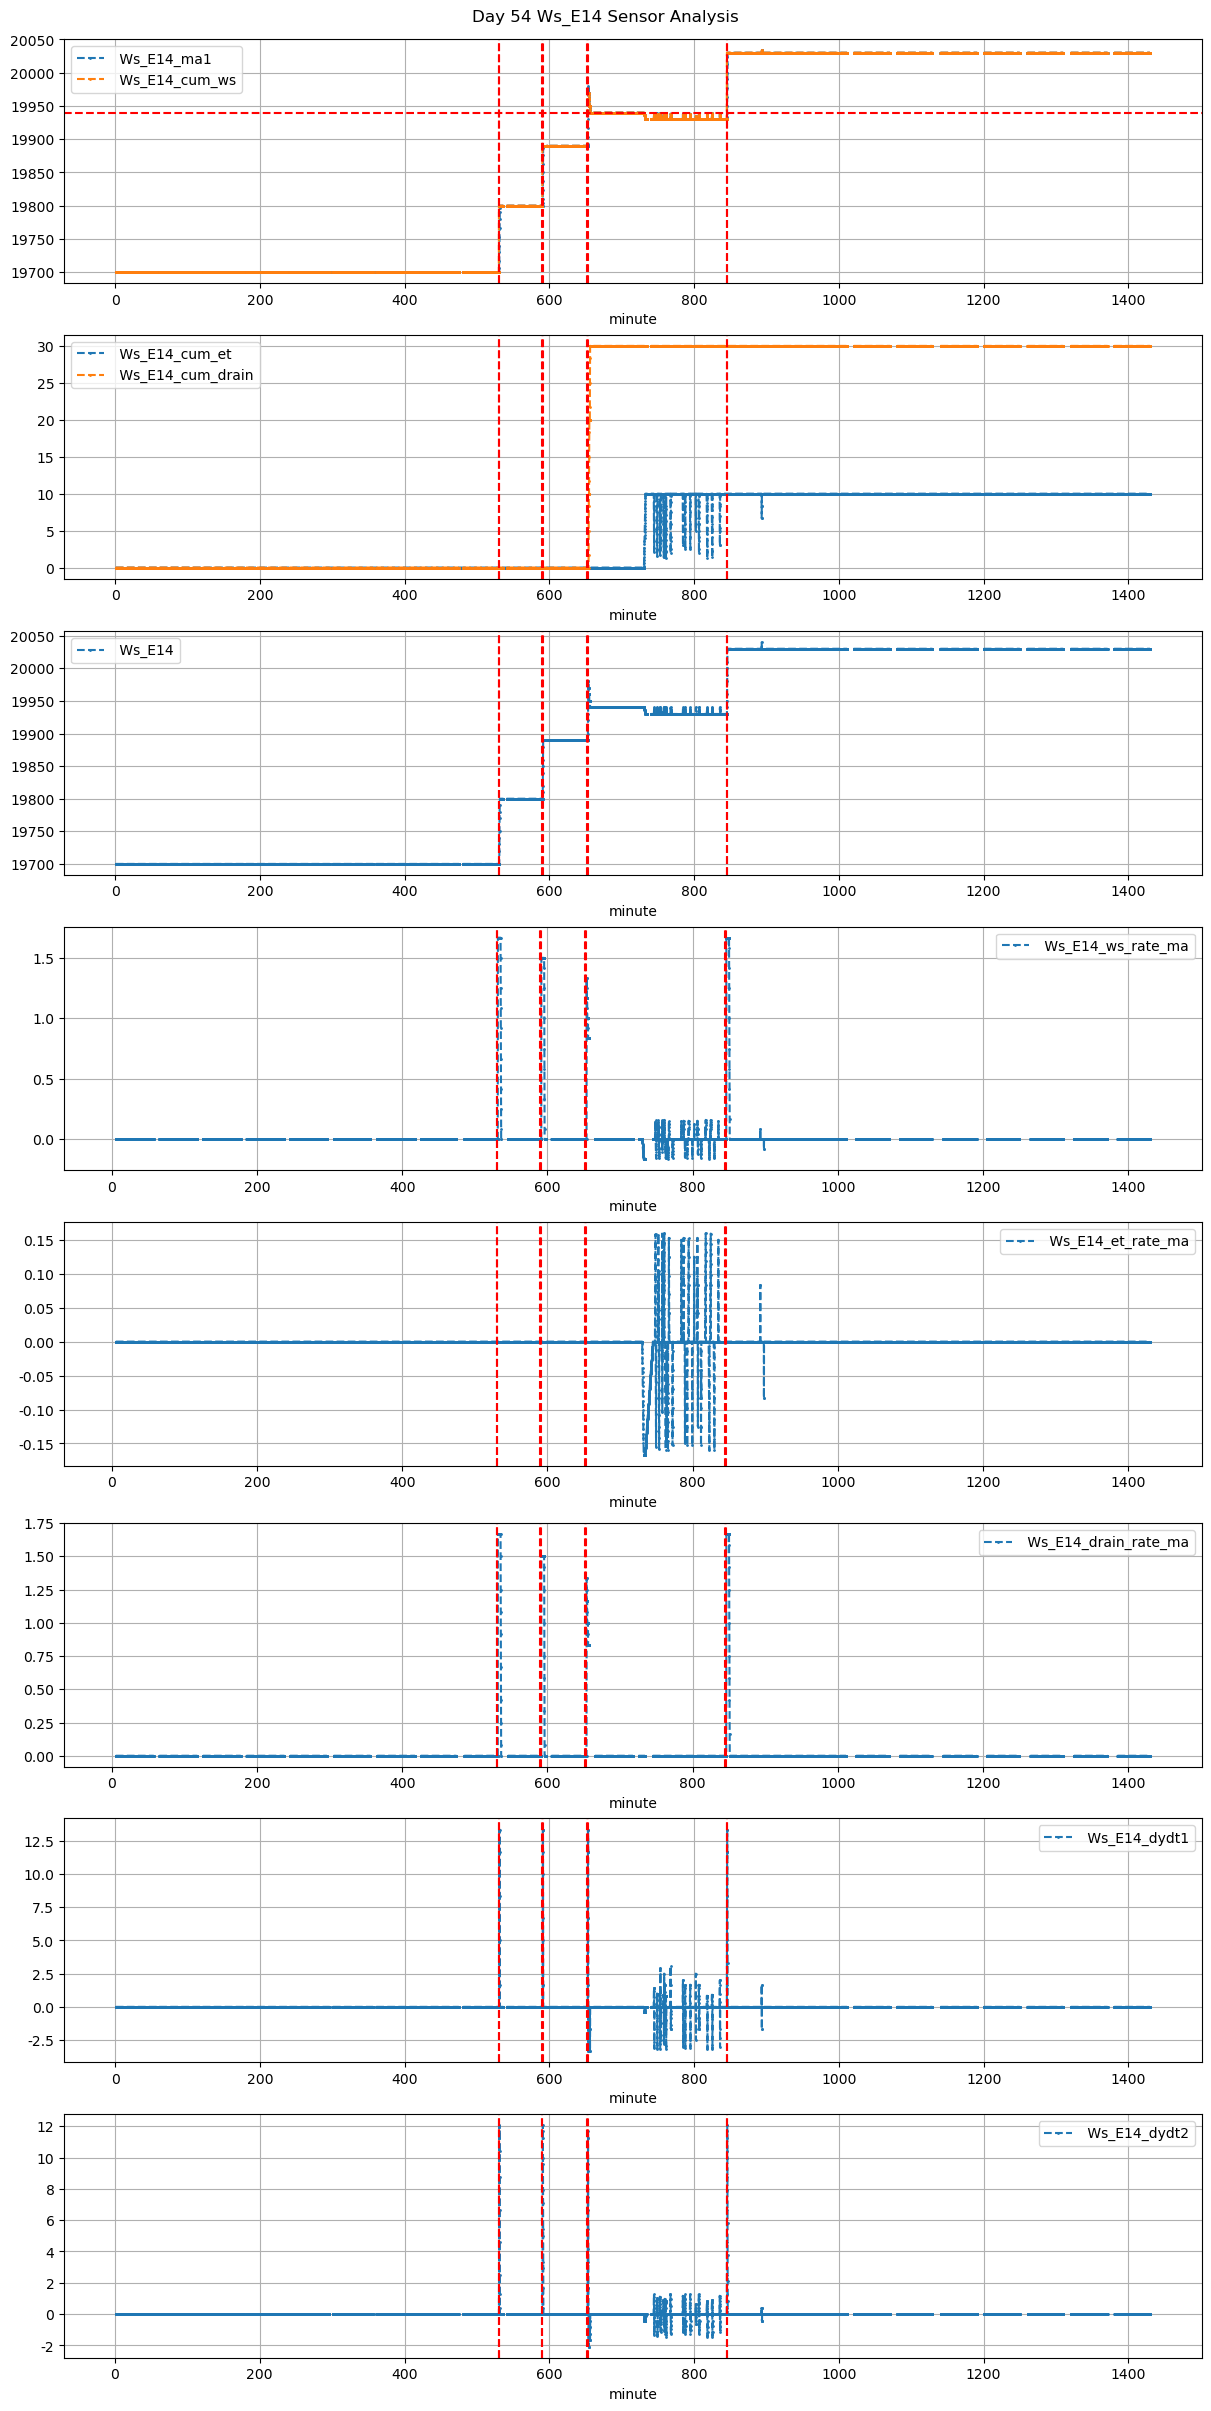
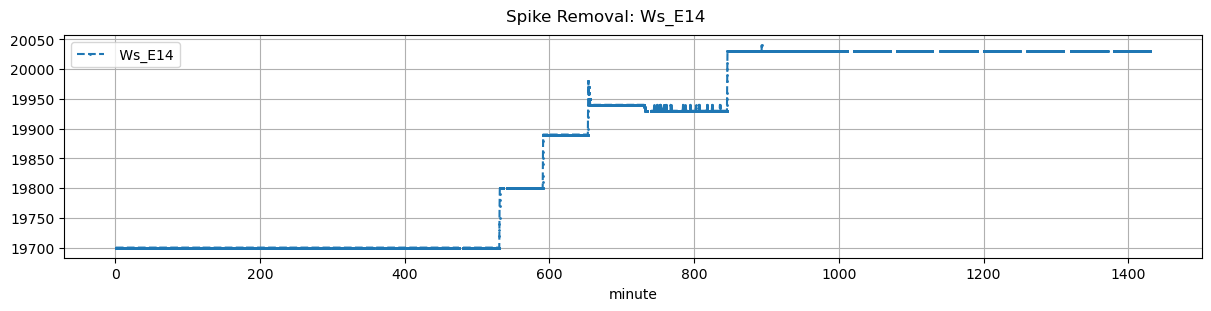
Ws_E14 |
2.326445 |
30 |
530.0 |
530.500000 |
530.57 |
531.750000 |
NaN |
NaN |
NaN |
19700.0 |
19800.0 |
34 |
0.000000 |
NaN |
0.0 |
0.416667 |
0.588235 |
20.0 |
30.0 |
70.8 |
20.0 |
0.0 |
0.0 |
NaN |
0.0 |
| 2025-11-29 09:50:00+08:00 |
54 |
590 |
Ws_E14 |
2.326445 |
30 |
590.0 |
590.500000 |
590.57 |
591.666667 |
NaN |
NaN |
NaN |
19800.0 |
19890.0 |
34 |
0.000000 |
0.0 |
0.0 |
0.410000 |
0.529412 |
18.0 |
30.0 |
65.8 |
18.0 |
0.0 |
0.0 |
NaN |
0.0 |
| 2025-11-29 10:52:24+08:00 |
54 |
652 |
Ws_E14 |
2.326445 |
30 |
652.4 |
652.916667 |
652.97 |
654.000000 |
NaN |
NaN |
NaN |
19890.0 |
19970.0 |
34 |
0.000000 |
NaN |
0.0 |
0.410000 |
0.470588 |
16.0 |
31.0 |
61.8 |
17.0 |
1.0 |
6.0 |
19940.0 |
7.0 |
| 2025-11-29 14:05:00+08:00 |
54 |
845 |
Ws_E14 |
2.326445 |
30 |
845.0 |
845.166667 |
845.57 |
846.416667 |
NaN |
NaN |
NaN |
19930.0 |
20030.0 |
34 |
-0.008475 |
0.0 |
0.0 |
0.416667 |
0.588235 |
20.0 |
10.0 |
50.8 |
20.0 |
0.0 |
0.0 |
NaN |
0.0 |