| 2025-11-24 08:55:00+08:00 |
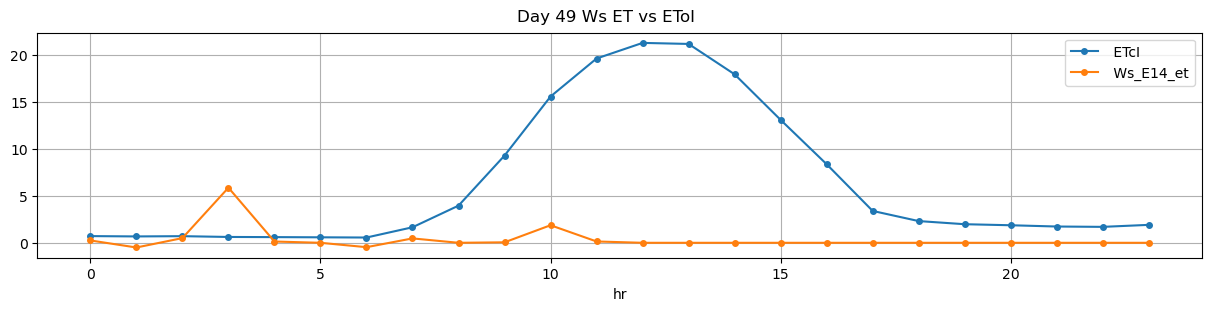
49 |
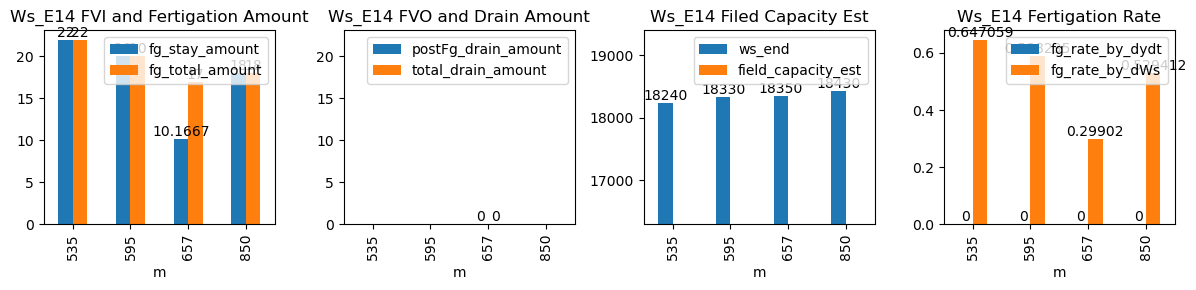
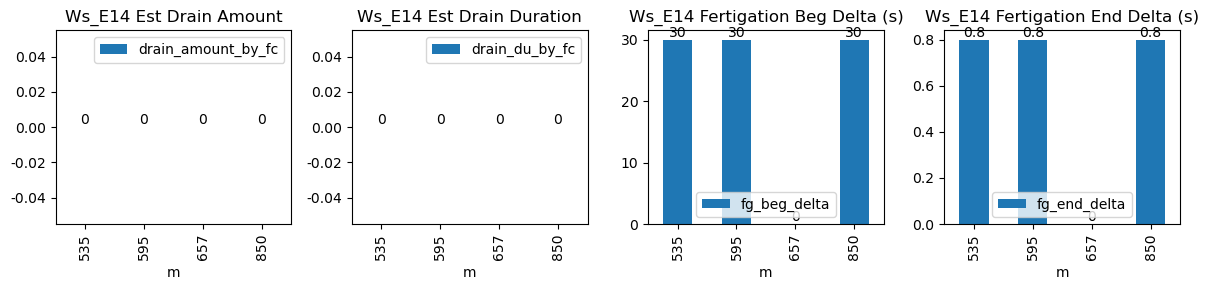
535 |
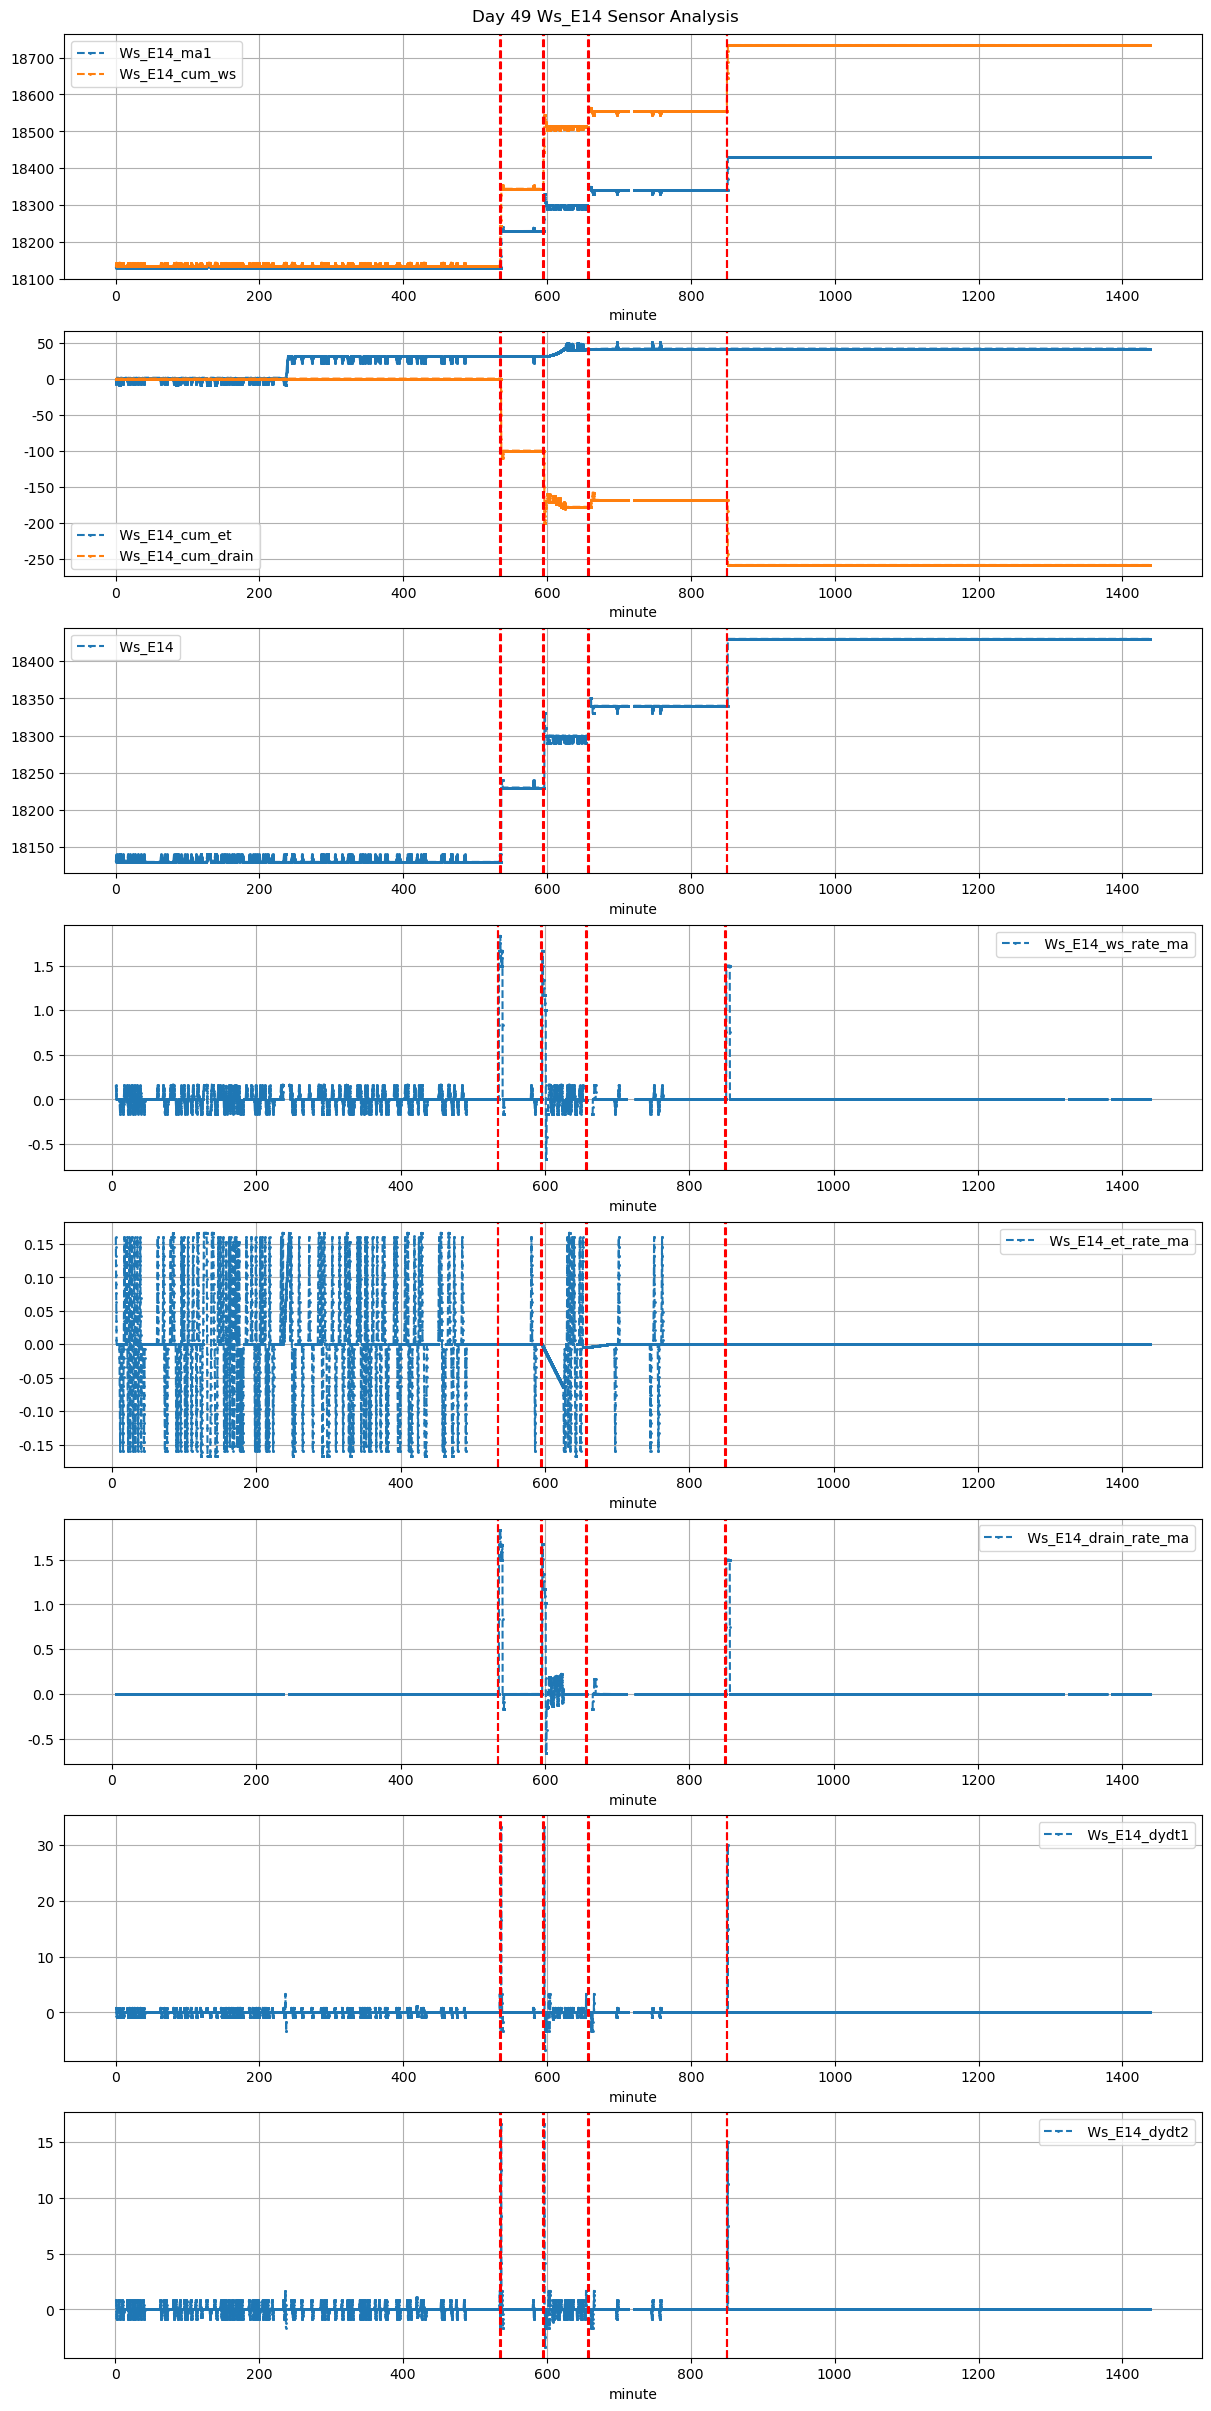
Ws_E14 |
1.723855 |
30 |
535.0 |
535.5 |
535.57 |
535.583333 |
NaN |
NaN |
NaN |
18130.000000 |
18240.0 |
34 |
0.000000 |
0.000000 |
0.000000 |
NaN |
0.647059 |
22.000000 |
30.0 |
0.8 |
22.0 |
0.000000 |
-20.000000 |
NaN |
-20.000000 |
| 2025-11-24 09:55:00+08:00 |
49 |
595 |
Ws_E14 |
1.723855 |
30 |
595.0 |
595.5 |
595.57 |
595.583333 |
NaN |
NaN |
NaN |
18230.000000 |
18330.0 |
34 |
0.000000 |
-0.048611 |
-0.064583 |
NaN |
0.588235 |
20.000000 |
30.0 |
0.8 |
20.0 |
0.000000 |
-15.587881 |
NaN |
-15.587881 |
| 2025-11-24 10:57:24+08:00 |
49 |
657 |
Ws_E14 |
1.723855 |
30 |
657.4 |
NaN |
657.97 |
NaN |
NaN |
NaN |
NaN |
18299.166667 |
18350.0 |
34 |
-0.004522 |
-0.059896 |
0.000000 |
NaN |
0.299020 |
10.166667 |
NaN |
NaN |
17.0 |
6.833333 |
NaN |
NaN |
NaN |
| 2025-11-24 14:10:00+08:00 |
49 |
850 |
Ws_E14 |
1.723855 |
30 |
850.0 |
850.5 |
850.57 |
850.583333 |
NaN |
NaN |
NaN |
18340.000000 |
18430.0 |
34 |
0.000000 |
0.000000 |
0.000000 |
NaN |
0.529412 |
18.000000 |
30.0 |
0.8 |
18.0 |
0.000000 |
-18.000000 |
NaN |
-18.000000 |