| 2025-11-23 09:01:04+08:00 |
48 |
541 |
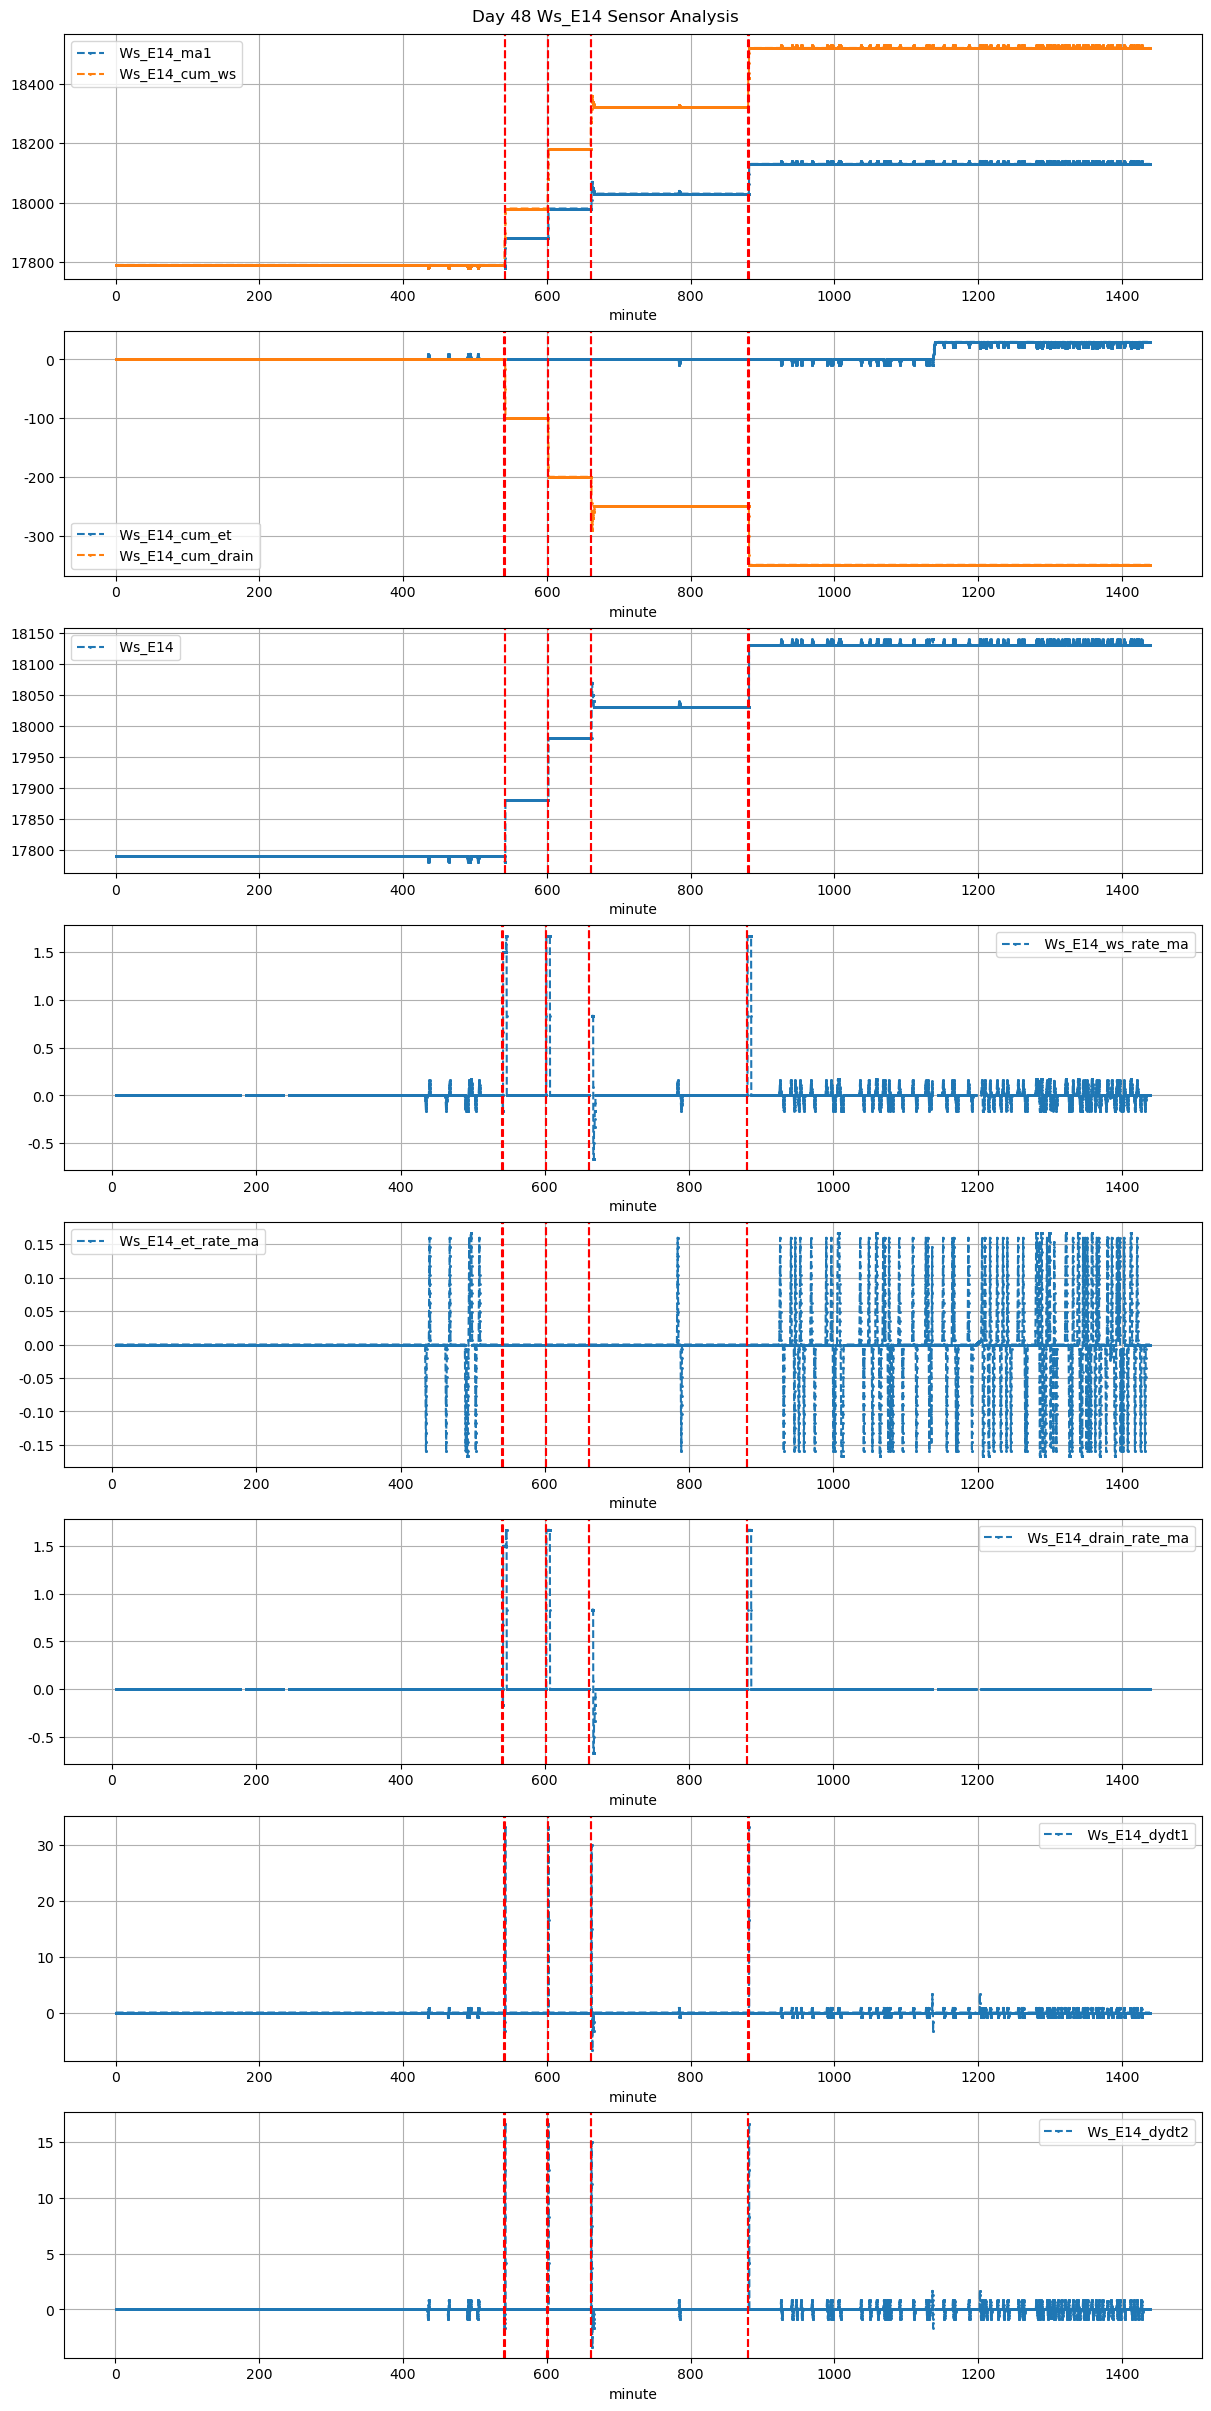
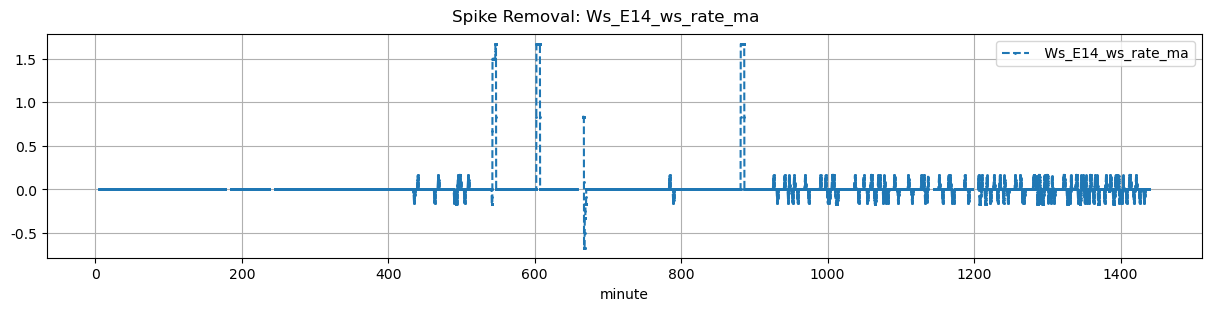
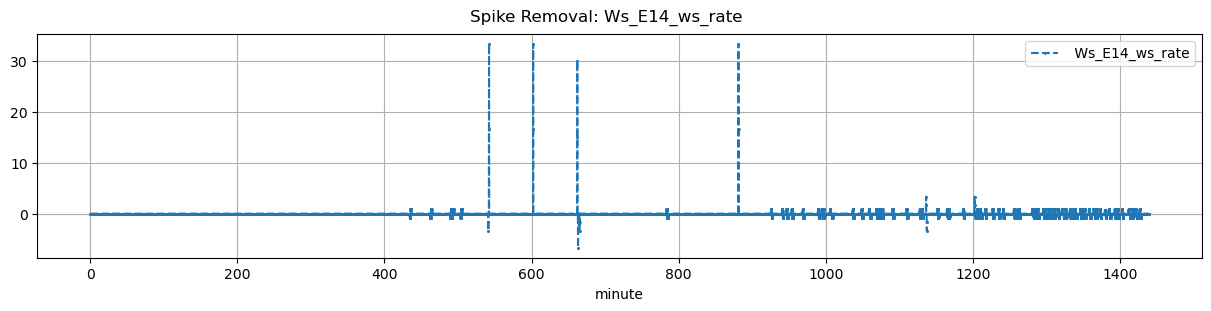
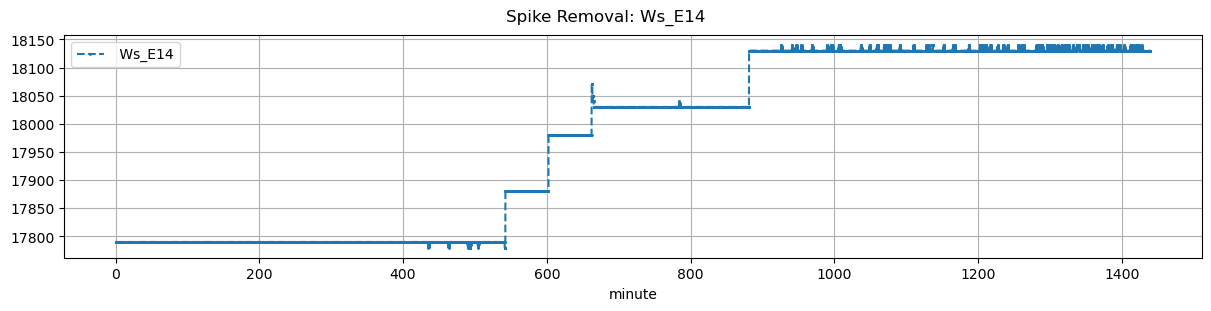
Ws_E14 |
1.731791 |
30 |
541.07 |
541.583333 |
541.64 |
541.666667 |
NaN |
NaN |
NaN |
17790.0 |
17880.0 |
34 |
0.0 |
0.000000 |
0.0 |
NaN |
0.529412 |
18.0 |
30.8 |
1.6 |
18.0 |
0.0 |
-20.0 |
NaN |
-20.0 |
| 2025-11-23 10:01:04+08:00 |
48 |
601 |
Ws_E14 |
1.731791 |
30 |
601.07 |
601.583333 |
601.64 |
601.666667 |
NaN |
NaN |
NaN |
17880.0 |
17980.0 |
34 |
0.0 |
0.000000 |
0.0 |
NaN |
0.588235 |
20.0 |
30.8 |
1.6 |
20.0 |
0.0 |
-20.0 |
NaN |
-20.0 |
| 2025-11-23 11:01:04+08:00 |
48 |
661 |
Ws_E14 |
1.731791 |
30 |
661.07 |
661.583333 |
661.64 |
661.666667 |
NaN |
NaN |
NaN |
17980.0 |
18070.0 |
34 |
0.0 |
-0.129167 |
0.0 |
NaN |
0.529412 |
18.0 |
30.8 |
1.6 |
18.0 |
0.0 |
-10.0 |
NaN |
-10.0 |
| 2025-11-23 14:40:00+08:00 |
48 |
880 |
Ws_E14 |
1.731791 |
30 |
880.00 |
880.500000 |
880.57 |
880.583333 |
NaN |
NaN |
NaN |
18030.0 |
18130.0 |
34 |
0.0 |
0.000000 |
0.0 |
NaN |
0.588235 |
20.0 |
30.0 |
0.8 |
20.0 |
0.0 |
-20.0 |
NaN |
-20.0 |