| 2025-11-22 08:10:00+08:00 |
47 |
490 |
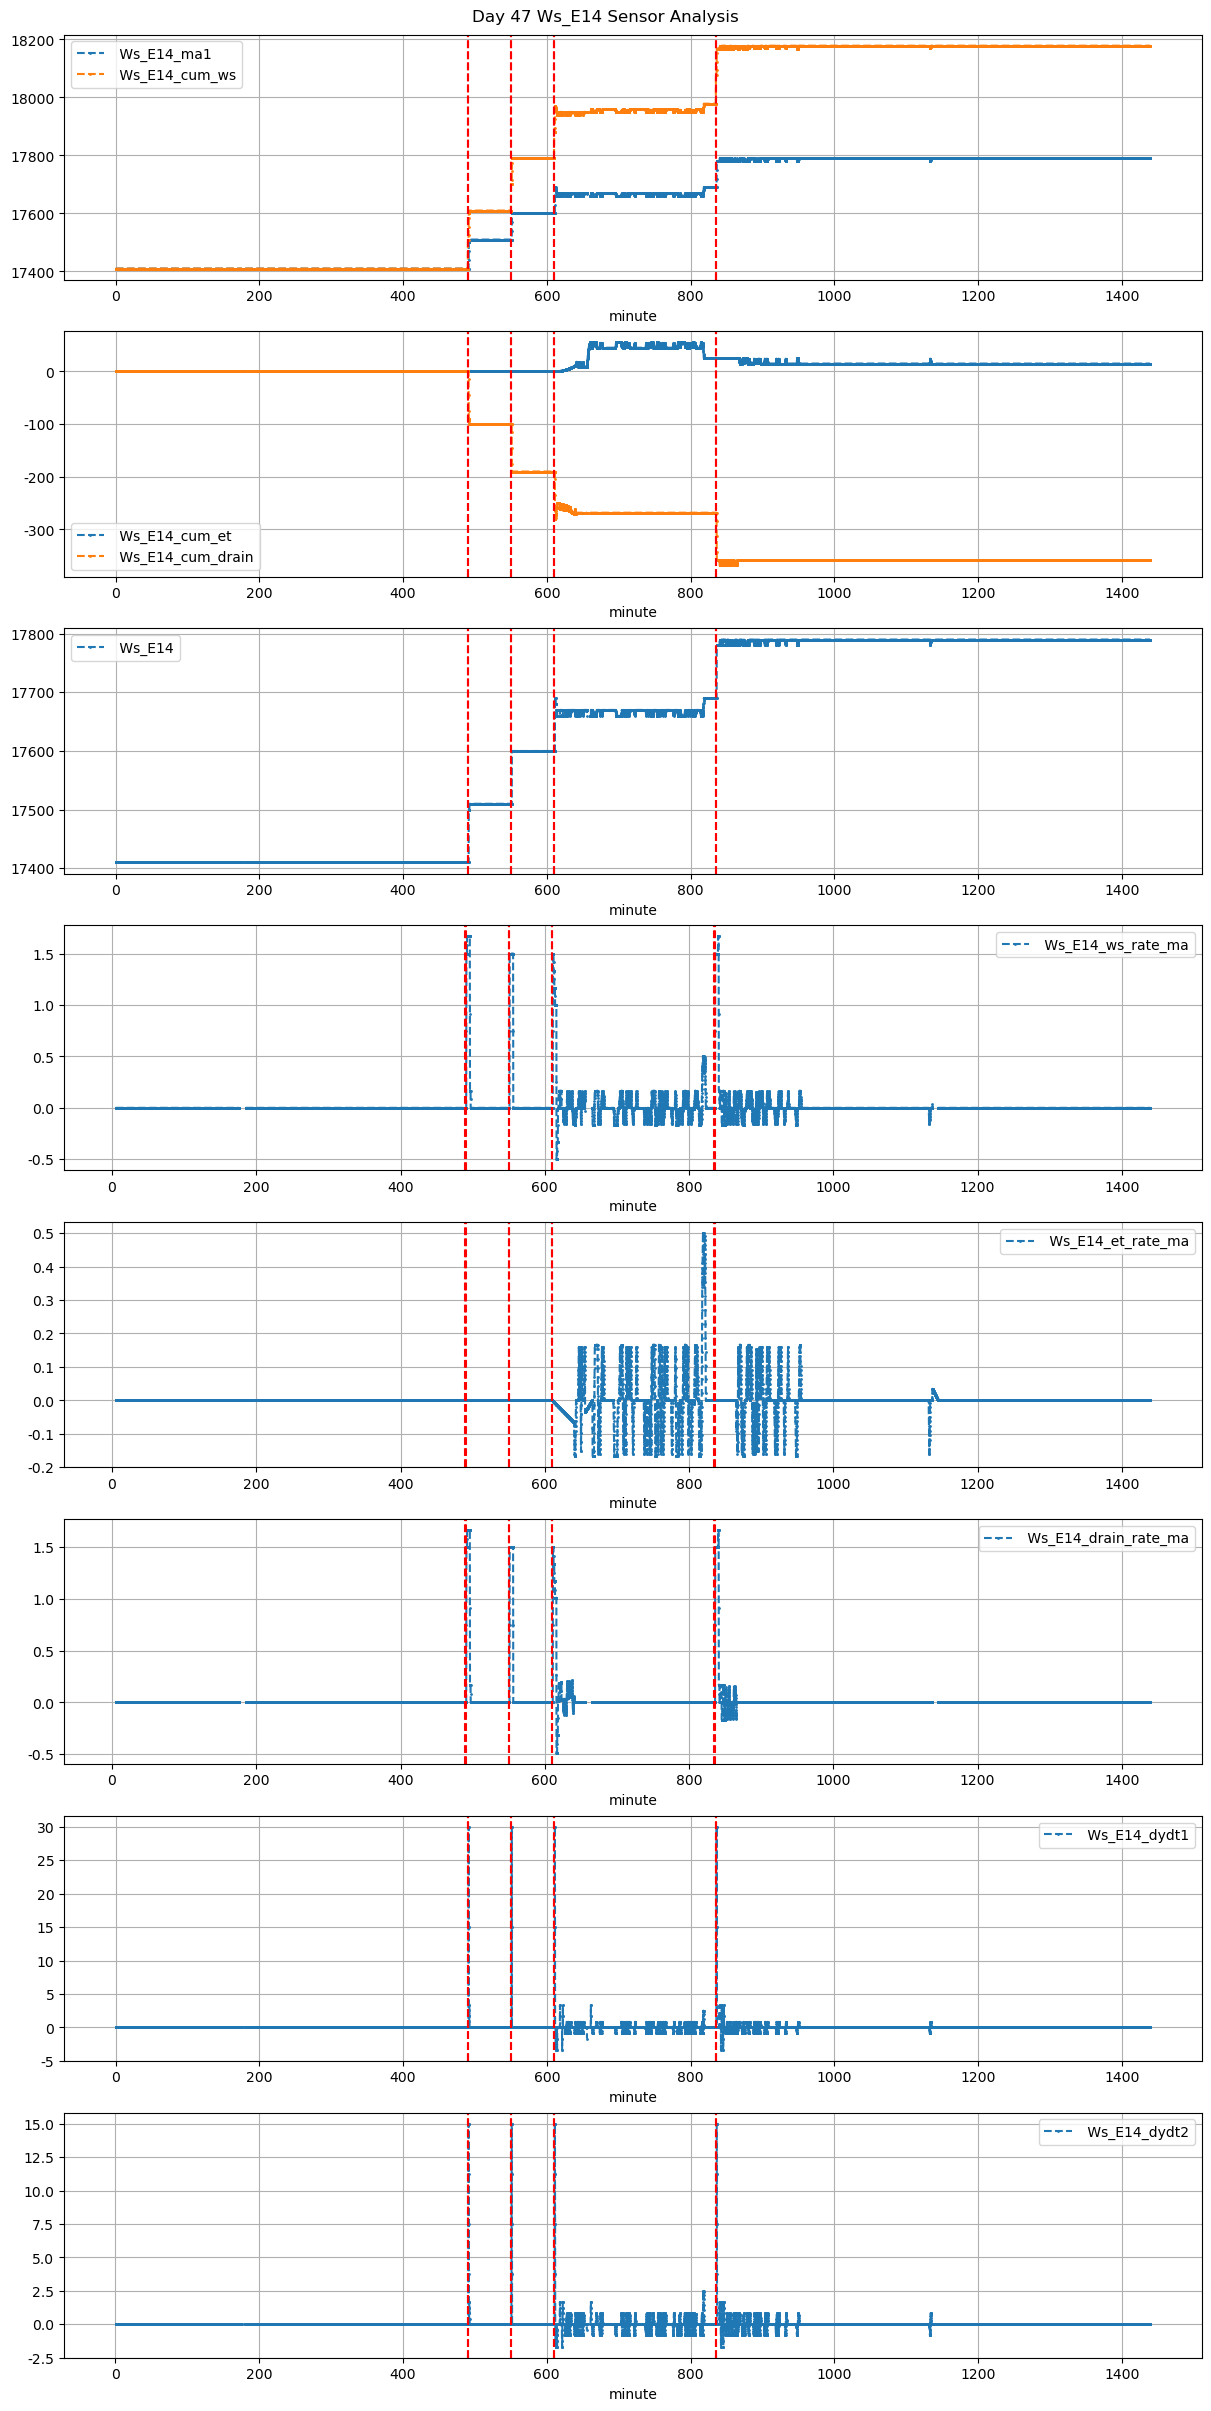
Ws_E14 |
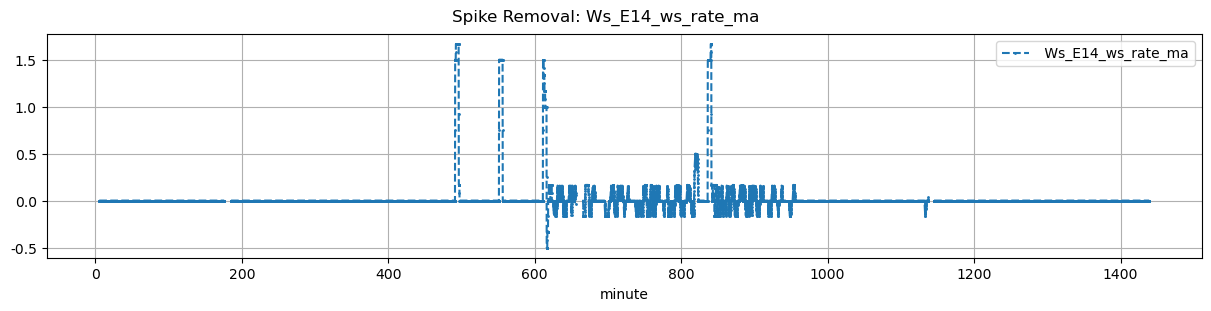
1.622445 |
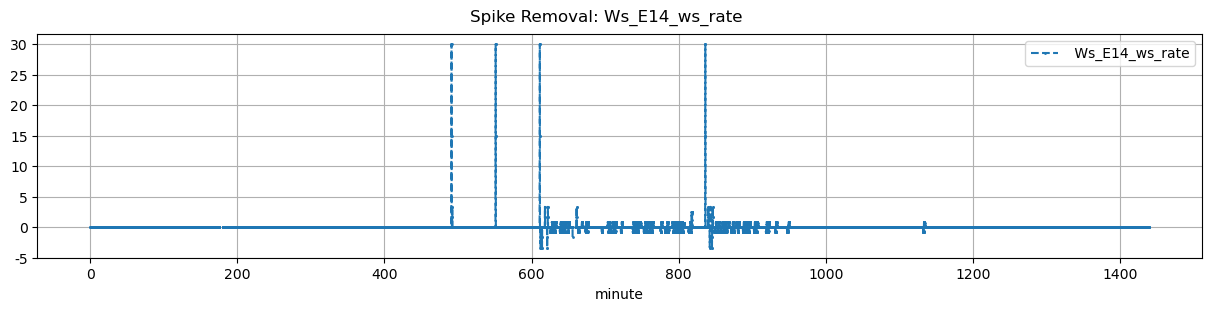
30 |
490.0 |
490.5 |
490.55 |
490.583333 |
NaN |
NaN |
NaN |
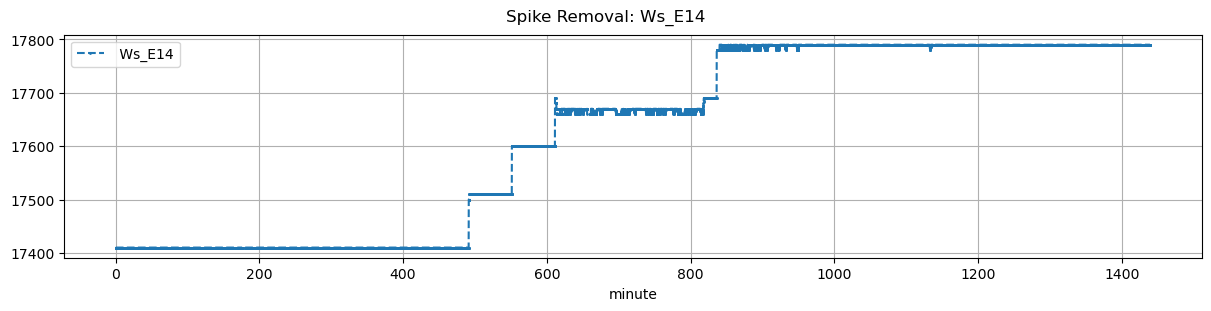
17410.0 |
17510.0 |
33 |
0.0 |
0.0 |
0.000000 |
NaN |
0.606061 |
20.0 |
30.0 |
2.0 |
20.0 |
0.0 |
-20.000000 |
NaN |
-20.000000 |
| 2025-11-22 09:10:00+08:00 |
47 |
550 |
Ws_E14 |
1.622445 |
30 |
550.0 |
550.5 |
550.55 |
550.583333 |
NaN |
NaN |
NaN |
17510.0 |
17600.0 |
33 |
0.0 |
0.0 |
0.000000 |
NaN |
0.545455 |
18.0 |
30.0 |
2.0 |
18.0 |
0.0 |
-18.000000 |
NaN |
-18.000000 |
| 2025-11-22 10:10:00+08:00 |
47 |
610 |
Ws_E14 |
1.622445 |
30 |
610.0 |
610.5 |
610.55 |
610.583333 |
NaN |
NaN |
NaN |
17600.0 |
17690.0 |
33 |
0.0 |
0.0 |
-0.065625 |
NaN |
0.545455 |
18.0 |
30.0 |
2.0 |
18.0 |
0.0 |
-15.625589 |
NaN |
-15.625589 |
| 2025-11-22 13:55:00+08:00 |
47 |
835 |
Ws_E14 |
1.622445 |
30 |
835.0 |
835.5 |
835.55 |
835.583333 |
NaN |
NaN |
NaN |
17690.0 |
17790.0 |
33 |
0.0 |
0.0 |
0.000000 |
NaN |
0.606061 |
20.0 |
30.0 |
2.0 |
20.0 |
0.0 |
-18.000000 |
NaN |
-18.000000 |