| 2025-11-21 07:40:00+08:00 |
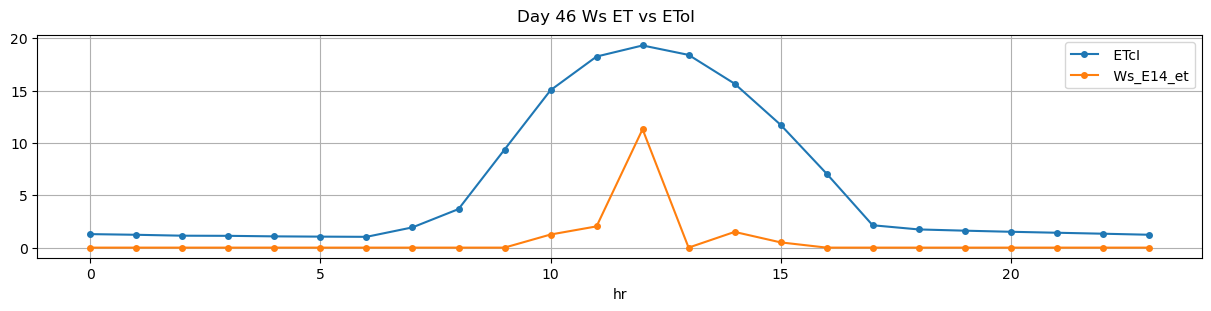
46 |
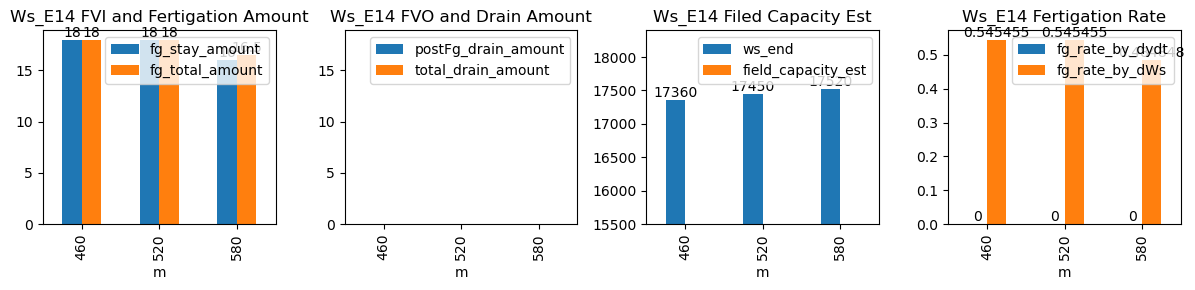
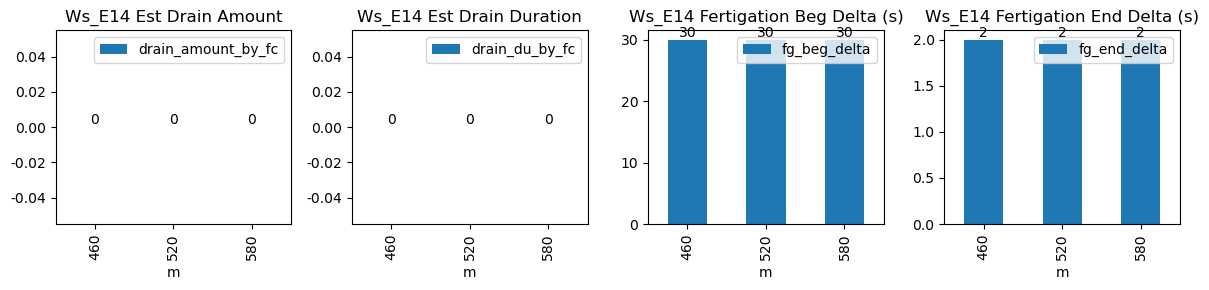
460 |
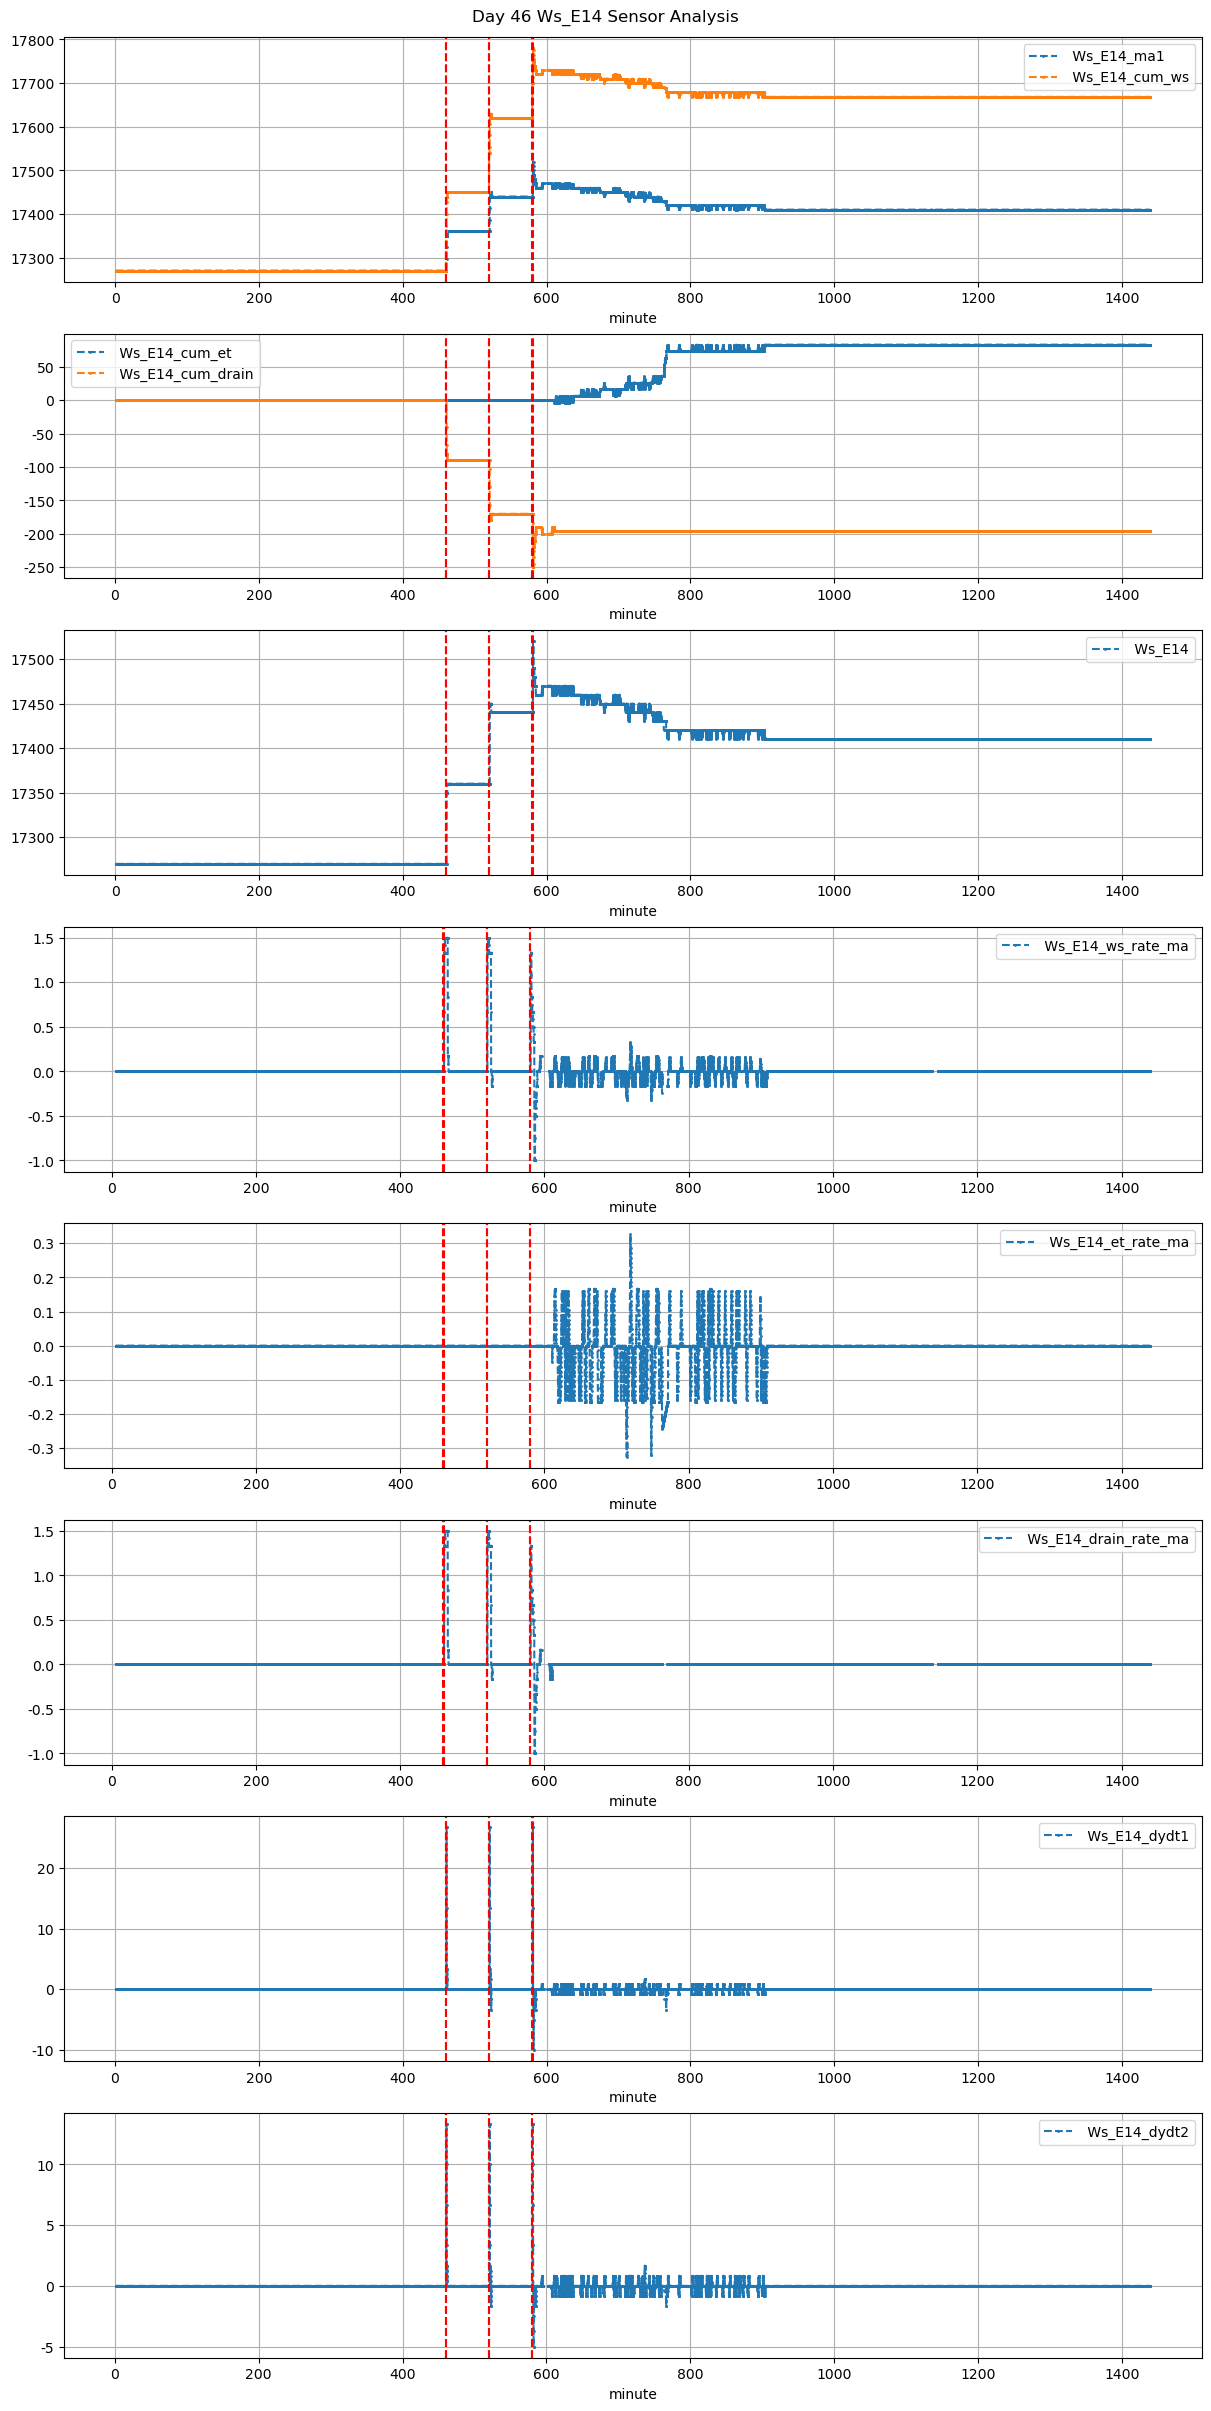
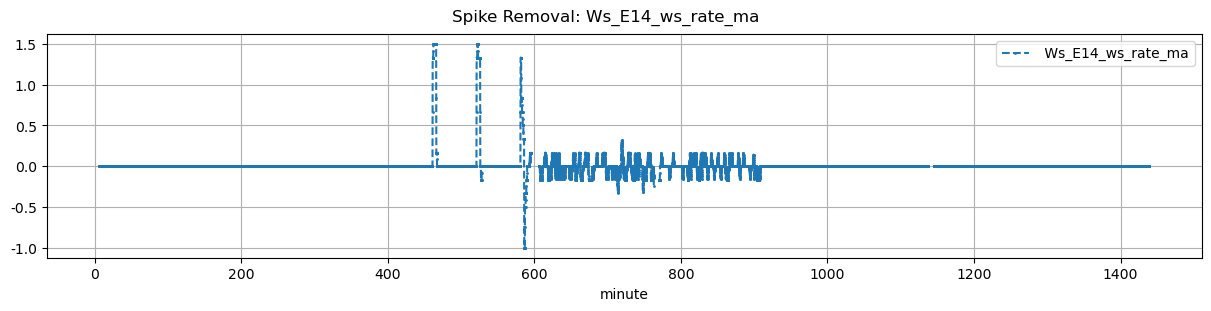
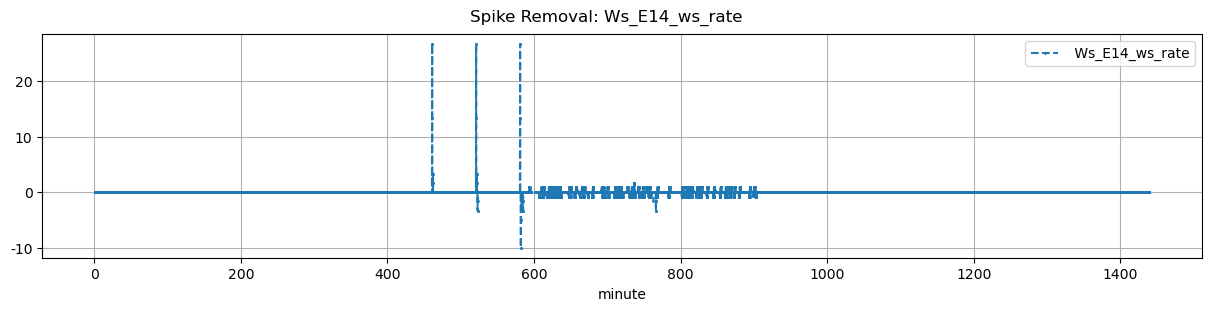
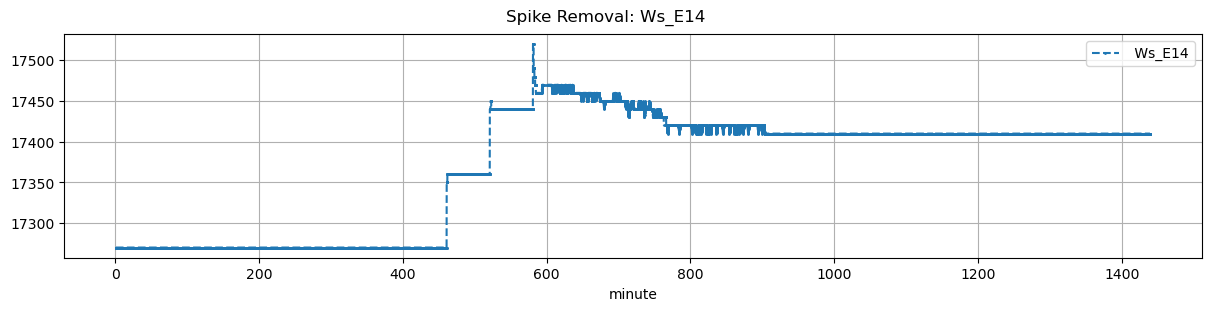
Ws_E14 |
2.21358 |
30 |
460.0 |
460.5 |
460.55 |
460.583333 |
NaN |
NaN |
NaN |
17270.0 |
17360.0 |
33 |
0.0 |
0.000000 |
0.0 |
NaN |
0.545455 |
18.0 |
30.0 |
2.0 |
18.0 |
0.0 |
-18.00 |
NaN |
-18.00 |
| 2025-11-21 08:40:00+08:00 |
46 |
520 |
Ws_E14 |
2.21358 |
30 |
520.0 |
520.5 |
520.55 |
520.583333 |
NaN |
NaN |
NaN |
17360.0 |
17450.0 |
33 |
0.0 |
0.000000 |
0.0 |
NaN |
0.545455 |
18.0 |
30.0 |
2.0 |
18.0 |
0.0 |
-16.00 |
NaN |
-16.00 |
| 2025-11-21 09:40:00+08:00 |
46 |
580 |
Ws_E14 |
2.21358 |
30 |
580.0 |
580.5 |
580.55 |
580.583333 |
NaN |
NaN |
NaN |
17440.0 |
17520.0 |
33 |
0.0 |
-0.369444 |
0.0 |
NaN |
0.484848 |
16.0 |
30.0 |
2.0 |
16.5 |
0.5 |
-5.25 |
NaN |
-4.75 |