| 2025-12-06 09:15:00+08:00 |
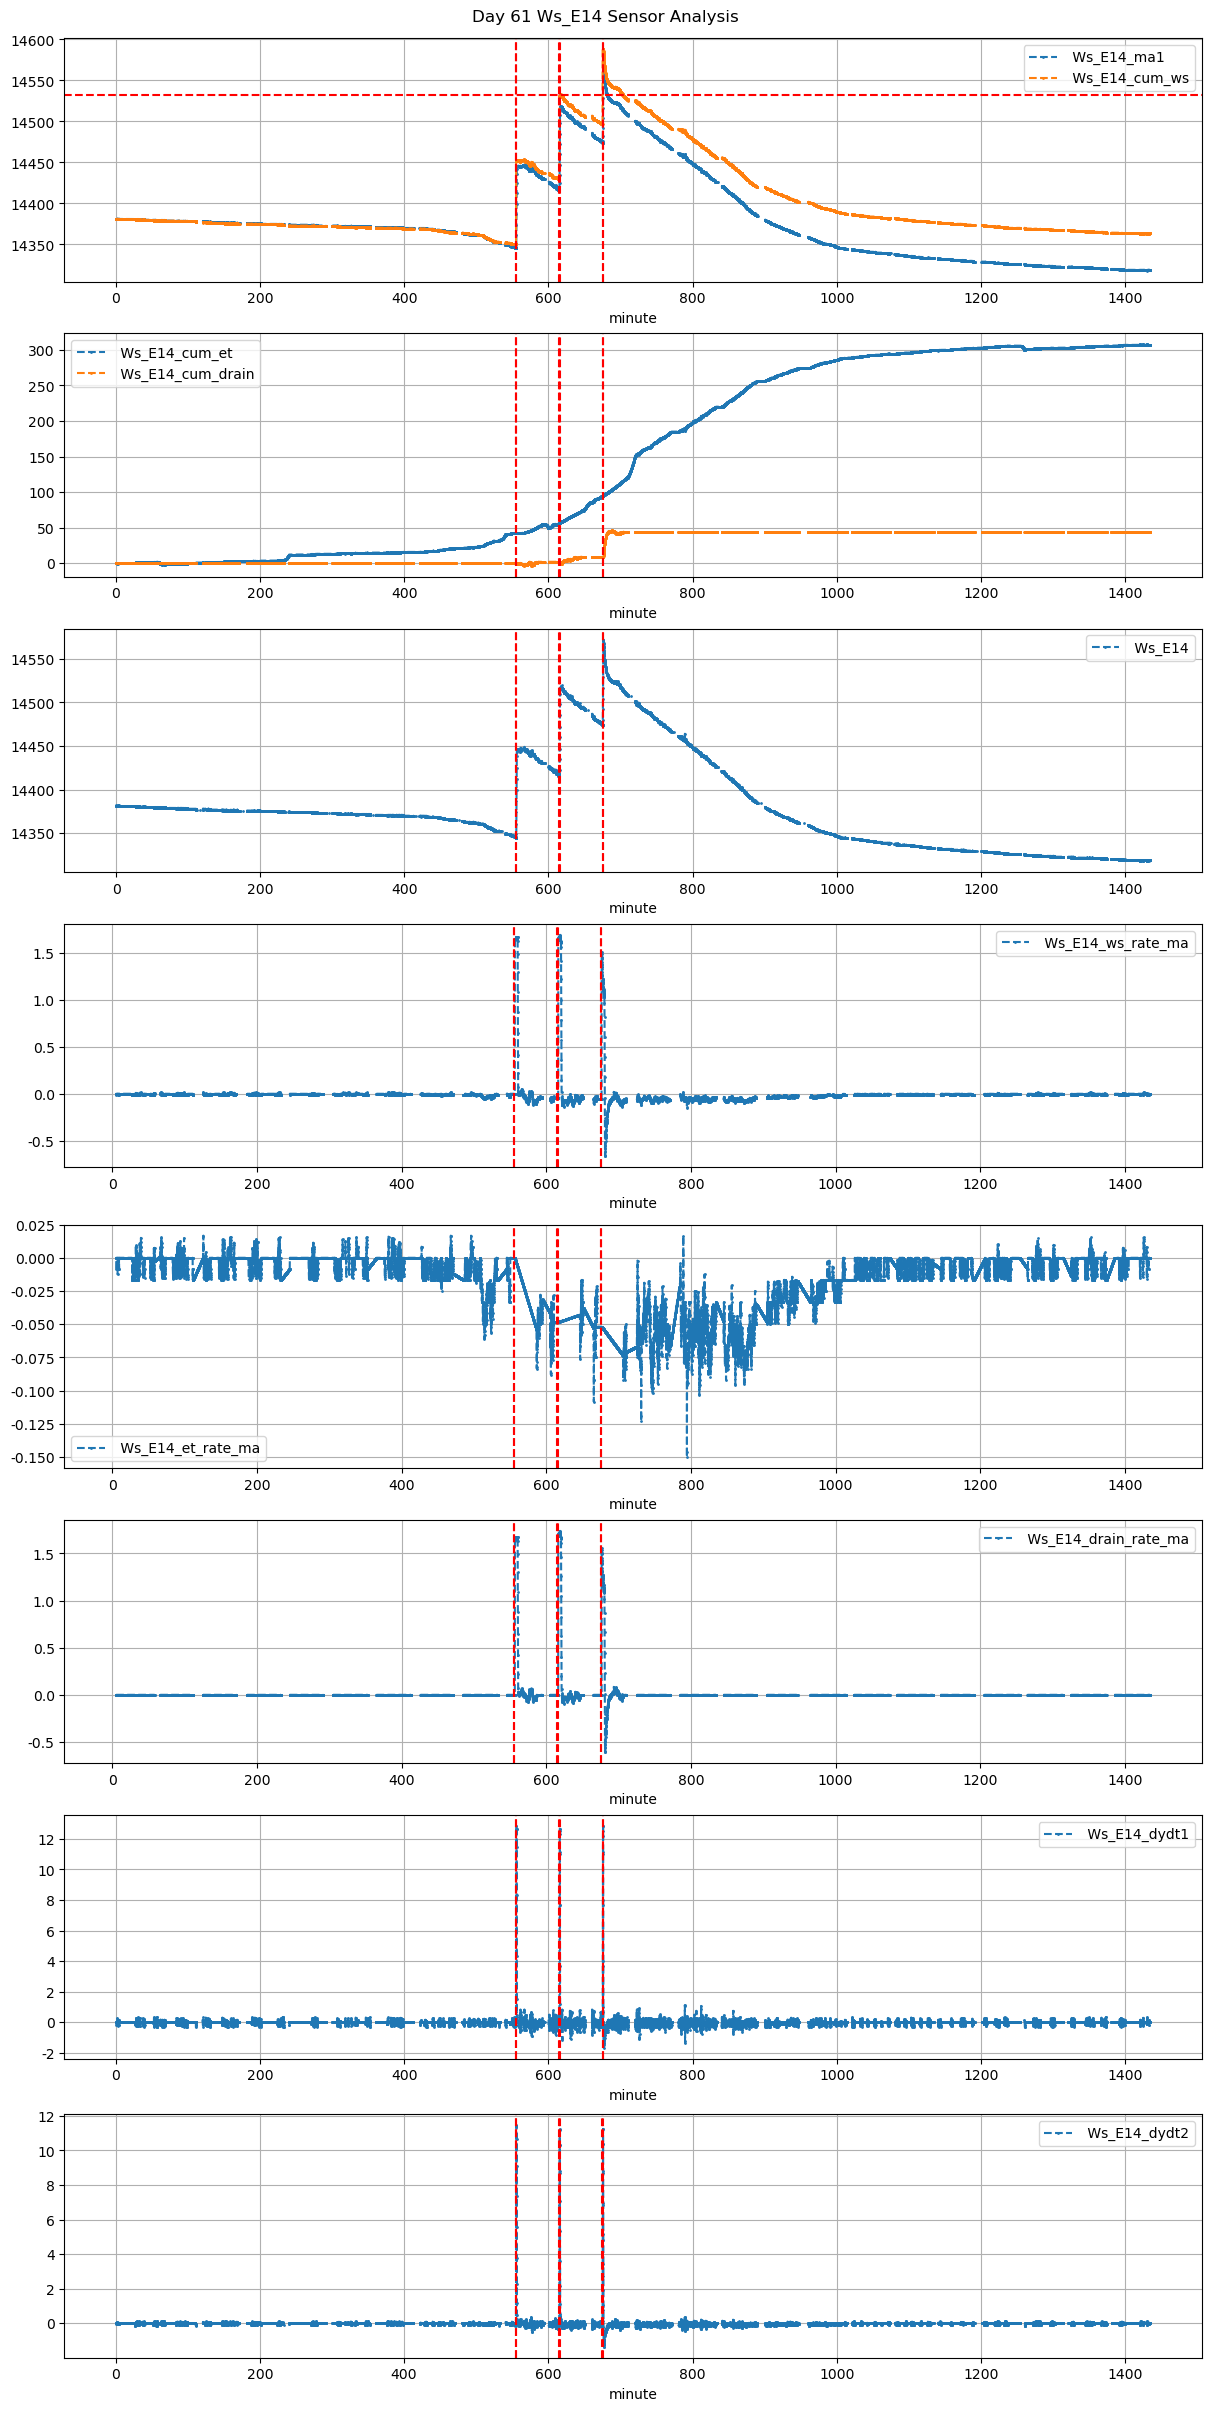
61 |
555 |
Ws_E14 |
0.340914 |
30 |
555.0 |
555.166667 |
555.6 |
556.416667 |
NaN |
NaN |
NaN |
14347.0 |
14448.0 |
36 |
-0.025706 |
0.000000 |
-0.054375 |
0.415714 |
0.561111 |
20.2 |
10.0 |
49.0 |
20.2 |
0.0 |
0.378416 |
NaN |
0.378416 |
| 2025-12-06 10:15:00+08:00 |
61 |
615 |
Ws_E14 |
0.340914 |
30 |
615.0 |
615.166667 |
615.6 |
616.416667 |
NaN |
NaN |
NaN |
14418.0 |
14520.0 |
36 |
-0.048305 |
-0.090972 |
-0.042775 |
0.411429 |
0.566667 |
20.4 |
10.0 |
49.0 |
20.4 |
0.0 |
1.339673 |
NaN |
1.339673 |
| 2025-12-06 11:15:00+08:00 |
61 |
675 |
Ws_E14 |
0.340914 |
30 |
675.0 |
675.250000 |
675.6 |
676.416667 |
NaN |
NaN |
NaN |
14476.0 |
14568.0 |
36 |
-0.051766 |
-0.280278 |
-0.073843 |
0.414571 |
0.511111 |
18.4 |
15.0 |
49.0 |
18.4 |
0.0 |
7.112482 |
14532.437591 |
7.112482 |