| 2025-12-07 07:45:00+08:00 |
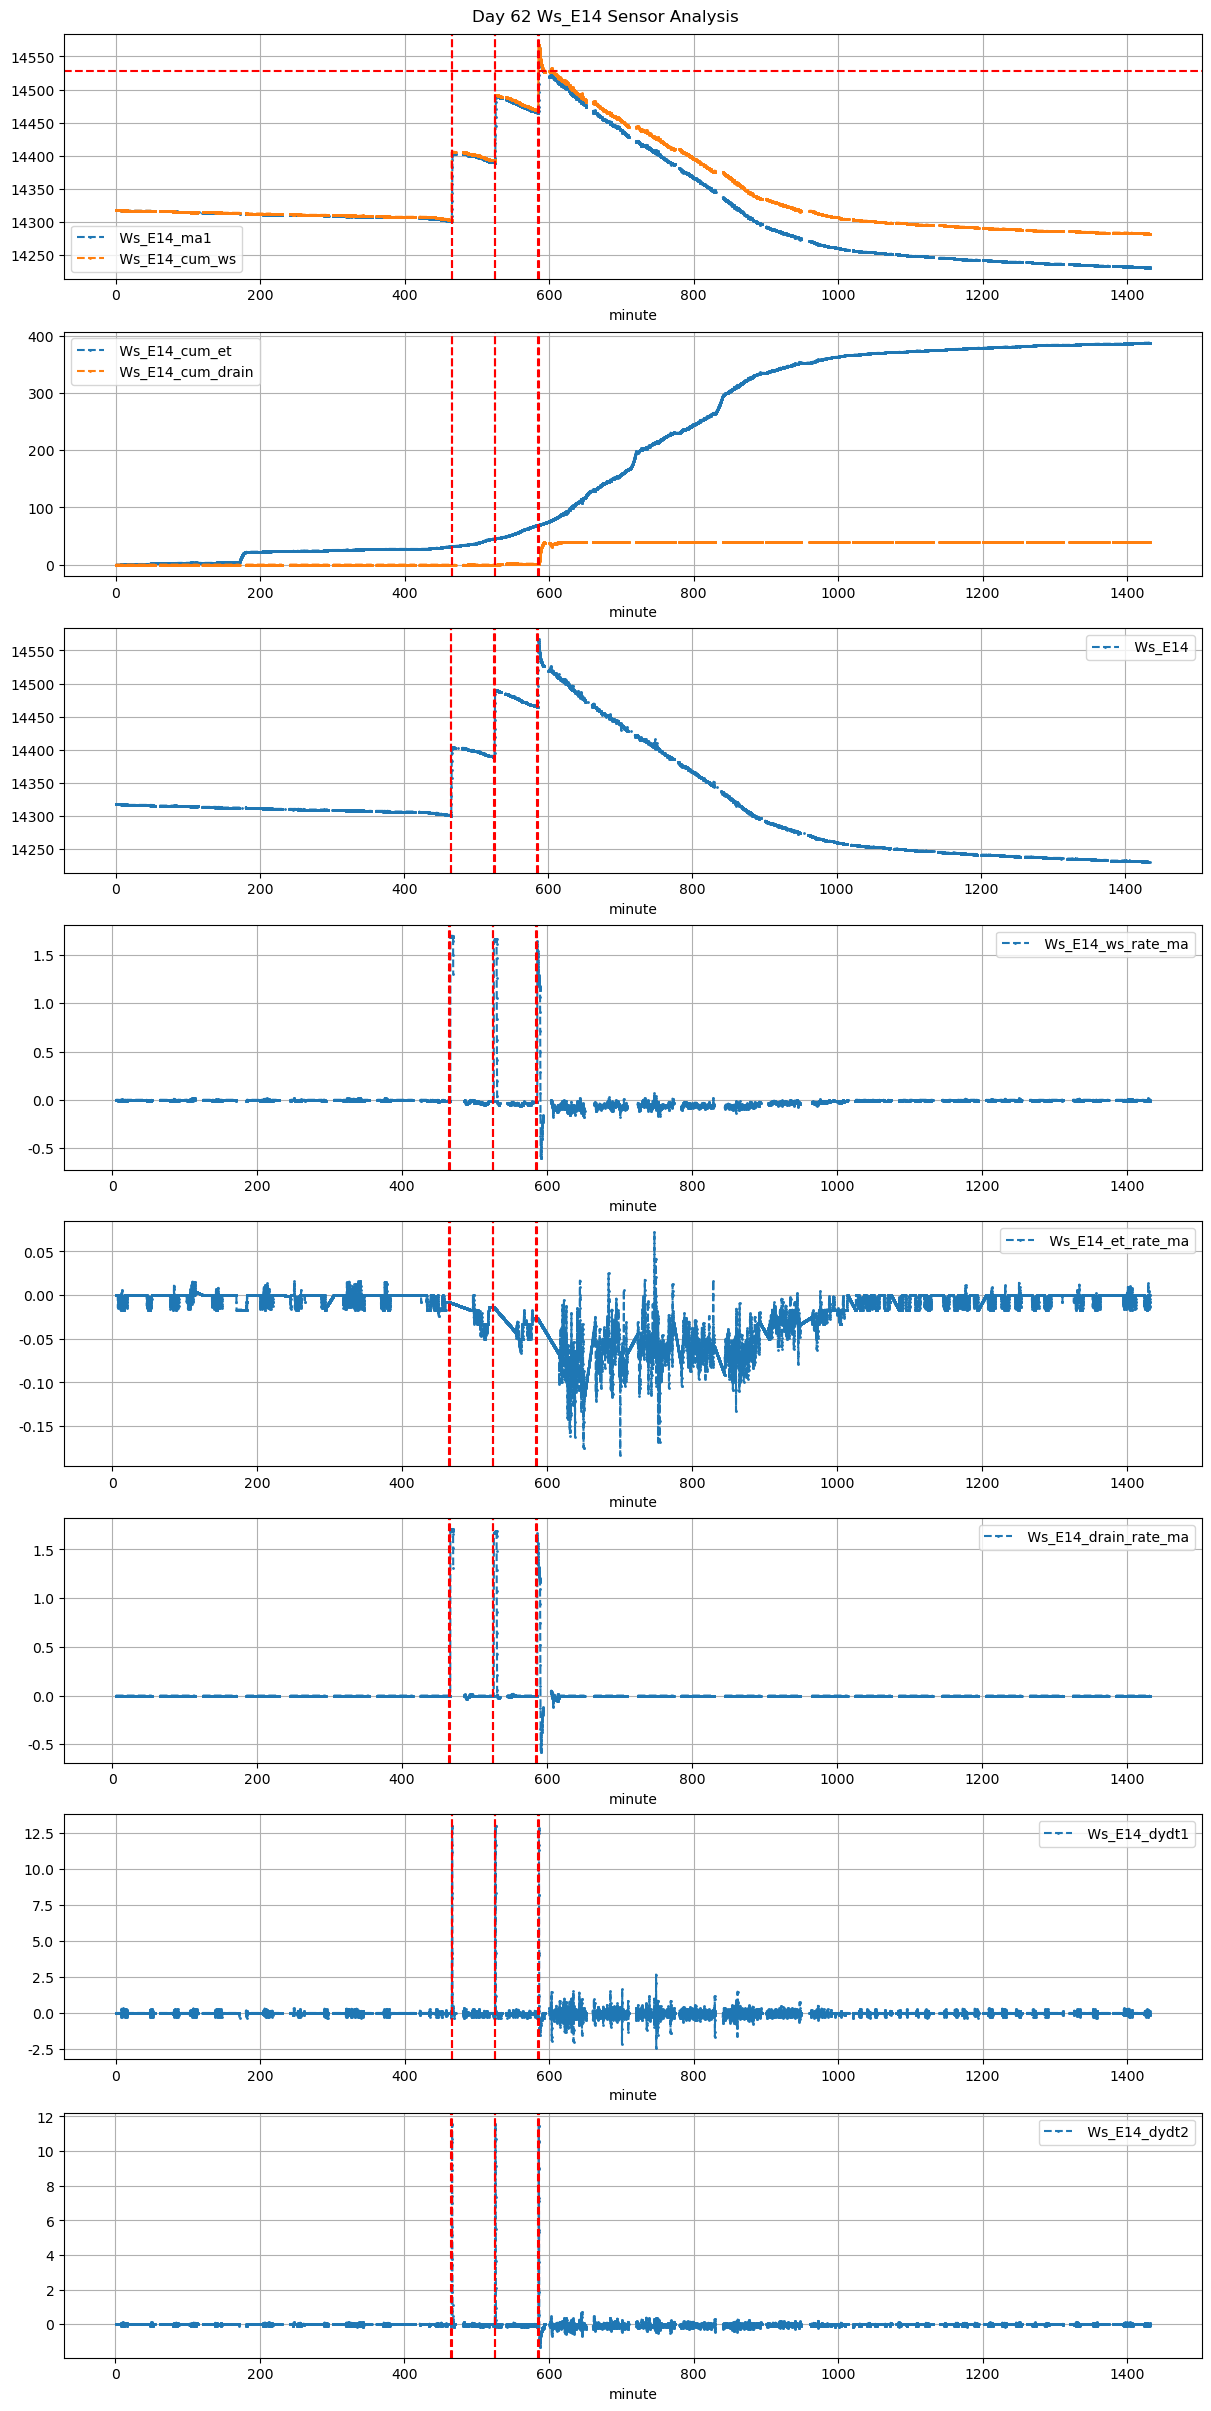
62 |
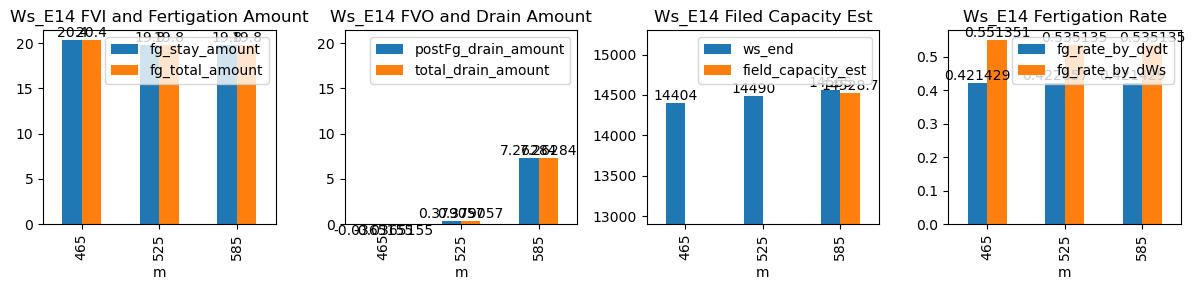
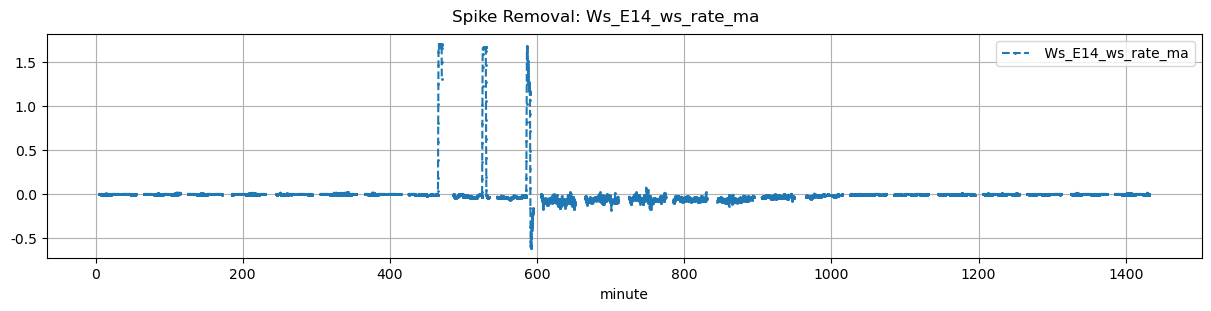
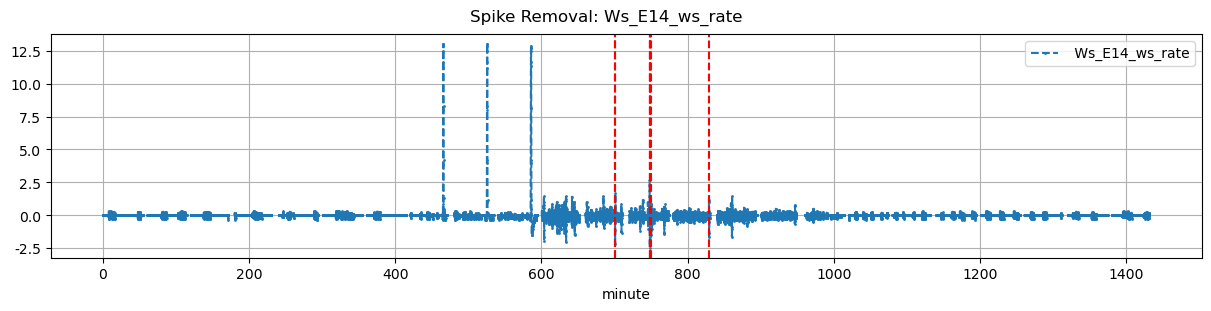
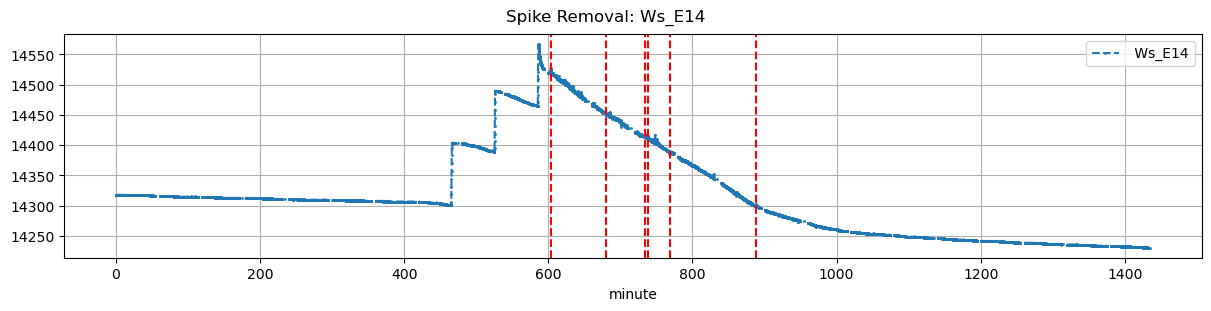
465 |
Ws_E14 |
0.370295 |
30 |
465.0 |
465.25 |
465.62 |
466.5 |
NaN |
NaN |
NaN |
14302.0 |
14404.0 |
37 |
-0.008475 |
NaN |
-0.017639 |
0.421429 |
0.551351 |
20.4 |
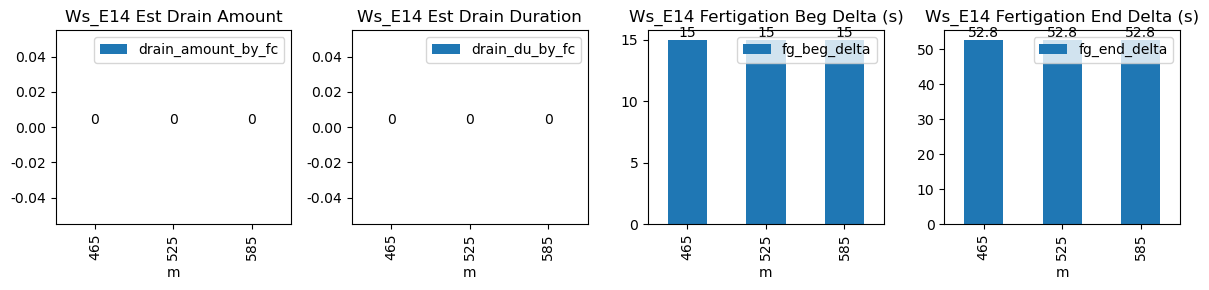
15.0 |
52.8 |
20.4 |
0.0 |
-0.036516 |
NaN |
-0.036516 |
| 2025-12-07 08:45:00+08:00 |
62 |
525 |
Ws_E14 |
0.370295 |
30 |
525.0 |
525.25 |
525.62 |
526.5 |
NaN |
NaN |
NaN |
14391.0 |
14490.0 |
37 |
-0.013842 |
-0.037393 |
-0.042454 |
0.422857 |
0.535135 |
19.8 |
15.0 |
52.8 |
19.8 |
0.0 |
0.379057 |
NaN |
0.379057 |
| 2025-12-07 09:45:00+08:00 |
62 |
585 |
Ws_E14 |
0.370295 |
30 |
585.0 |
585.25 |
585.62 |
586.5 |
NaN |
NaN |
NaN |
14466.0 |
14565.0 |
37 |
-0.026243 |
-0.338462 |
-0.067870 |
0.421429 |
0.535135 |
19.8 |
15.0 |
52.8 |
19.8 |
0.0 |
7.262843 |
14528.685783 |
7.262843 |