| 2025-12-08 07:45:00+08:00 |
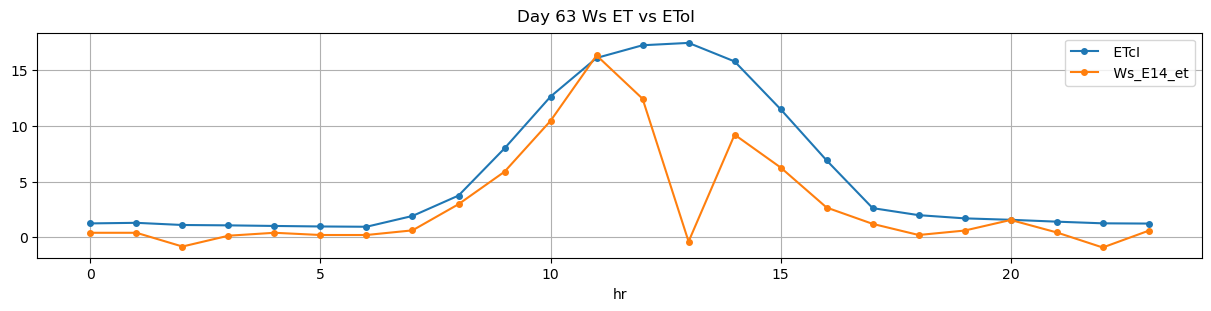
63 |
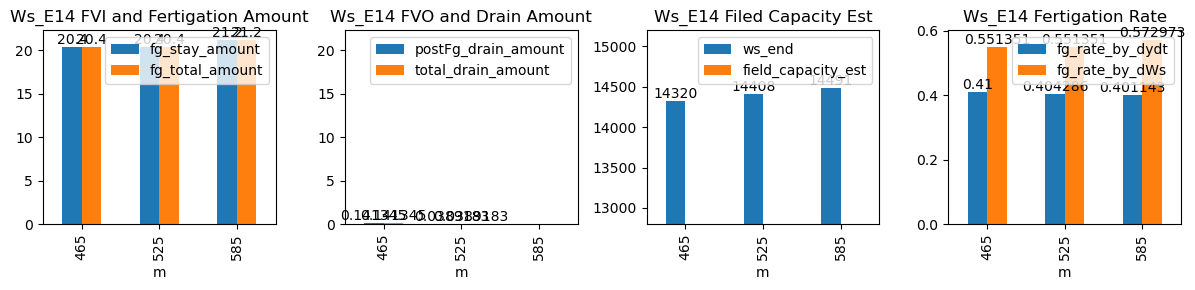
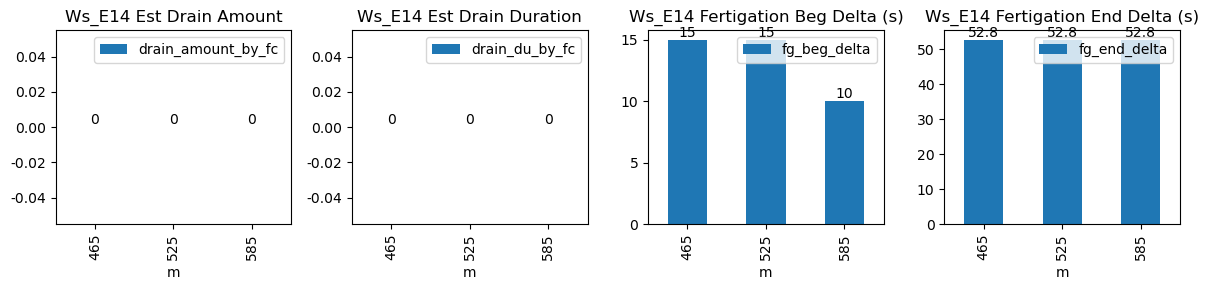
465 |
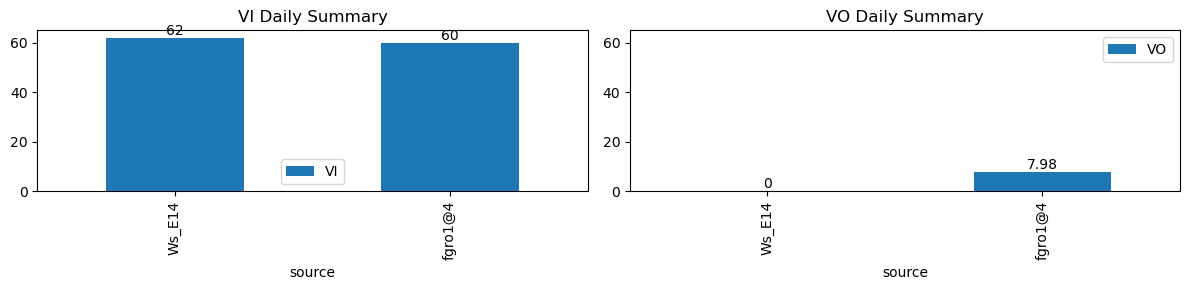
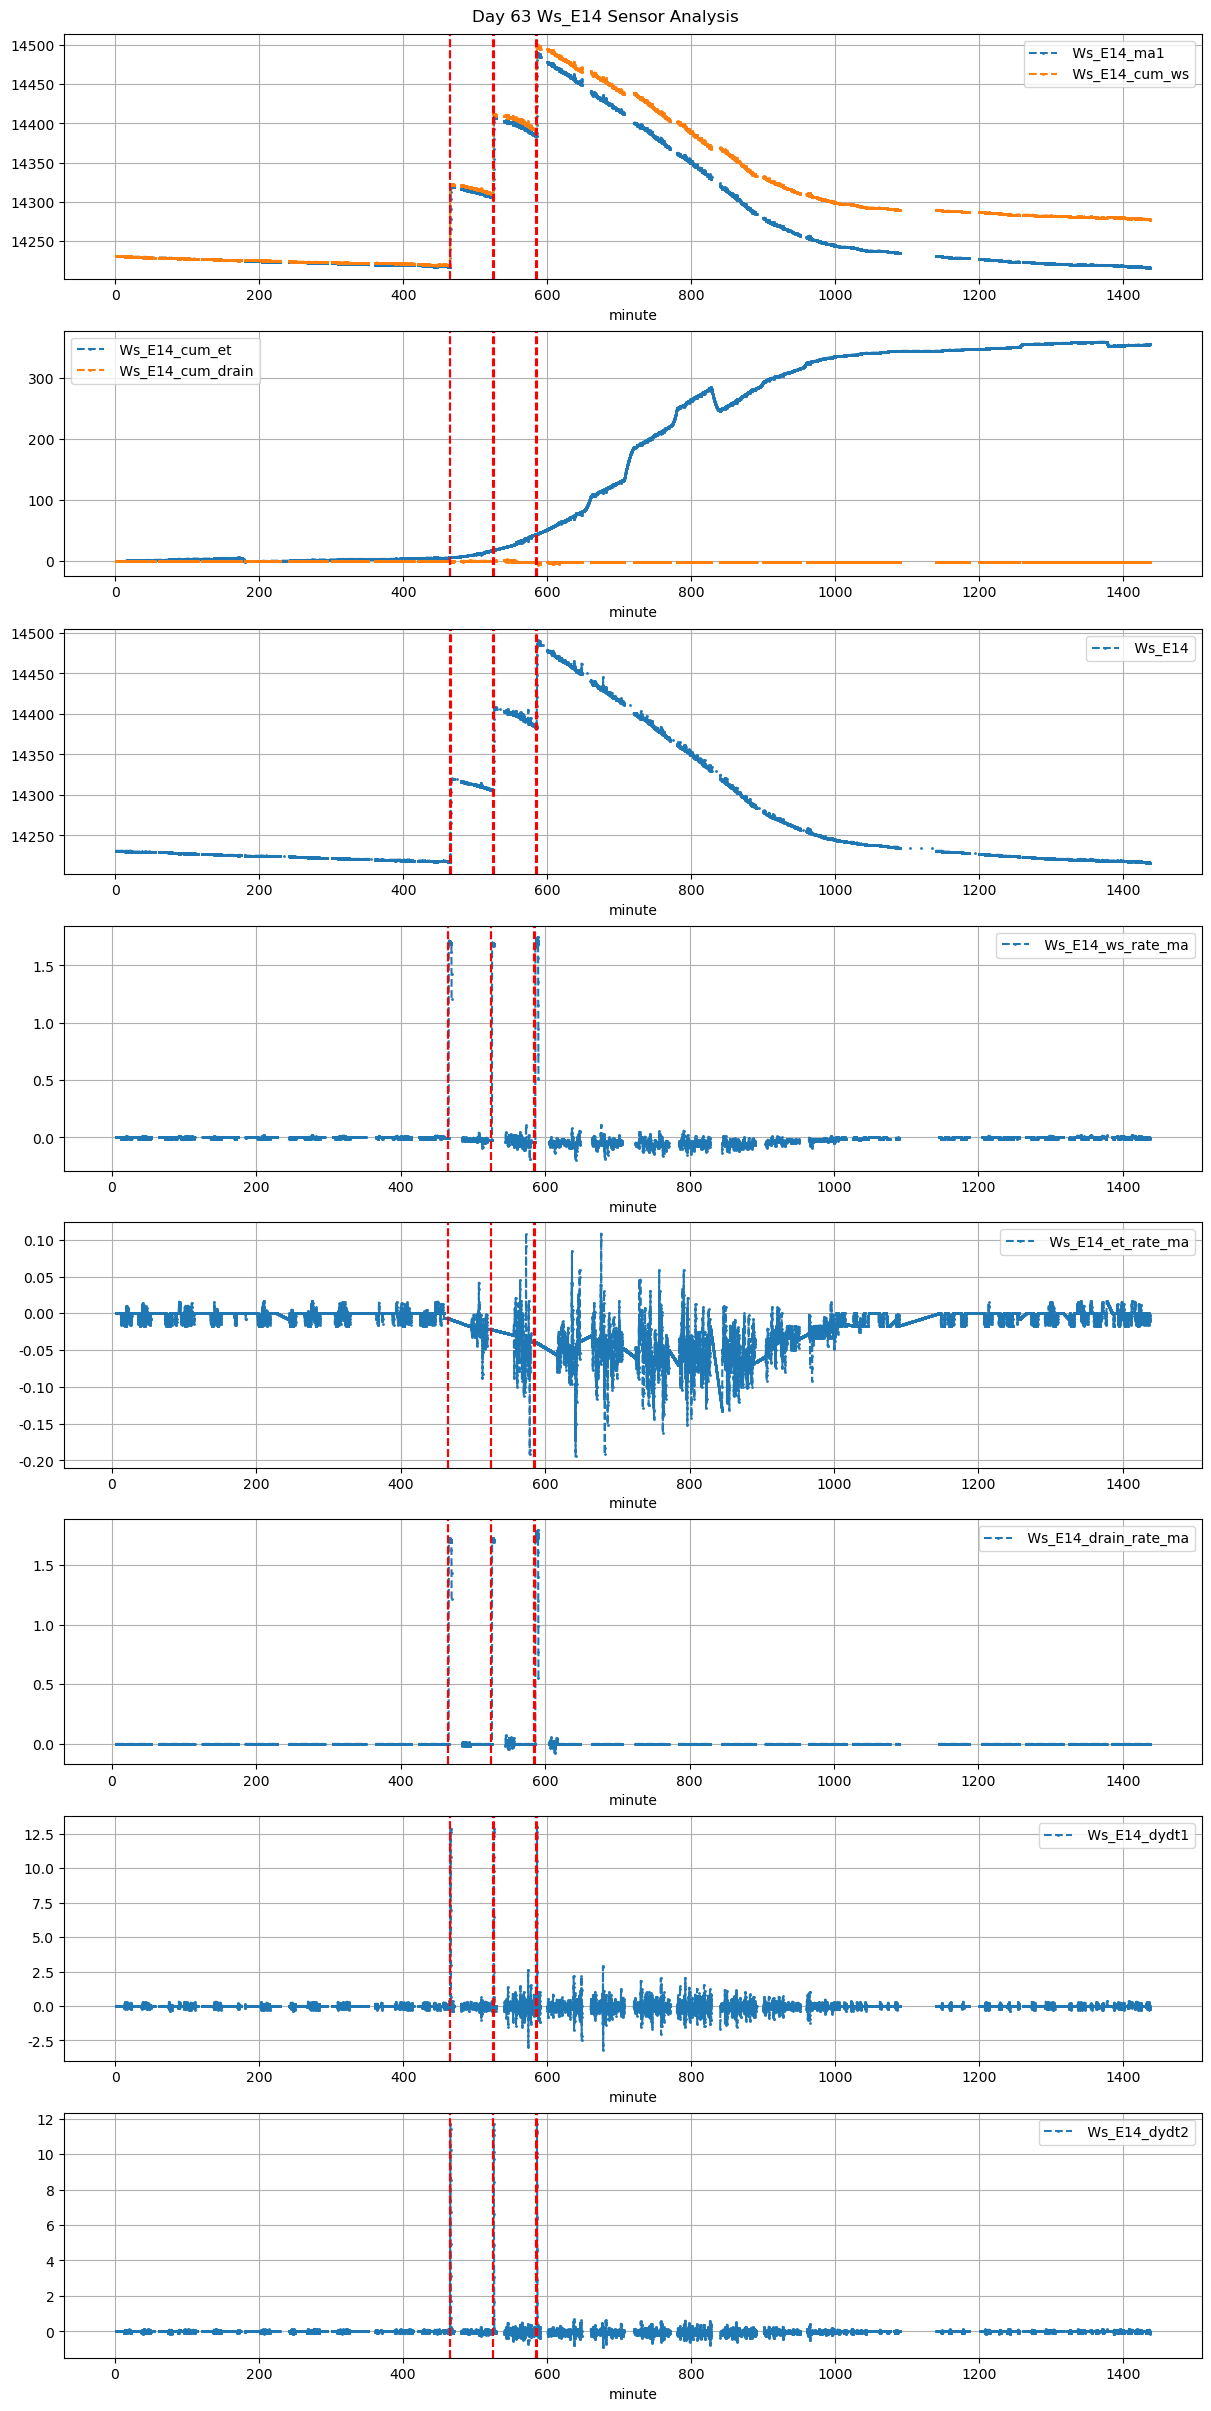
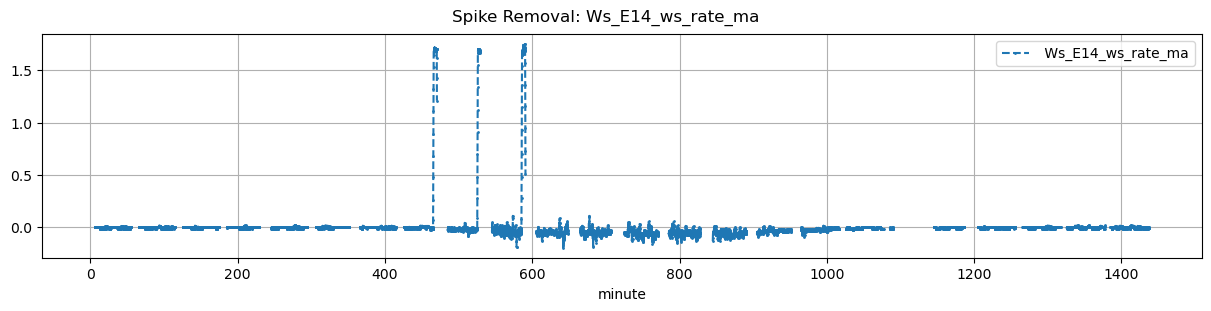
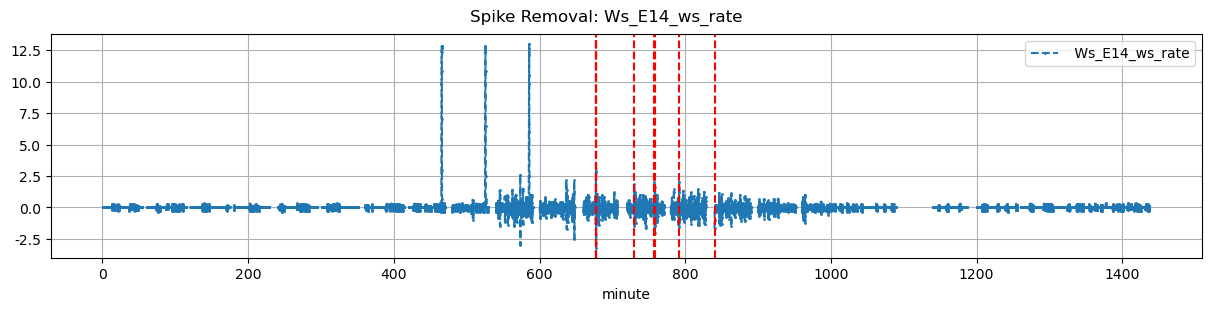
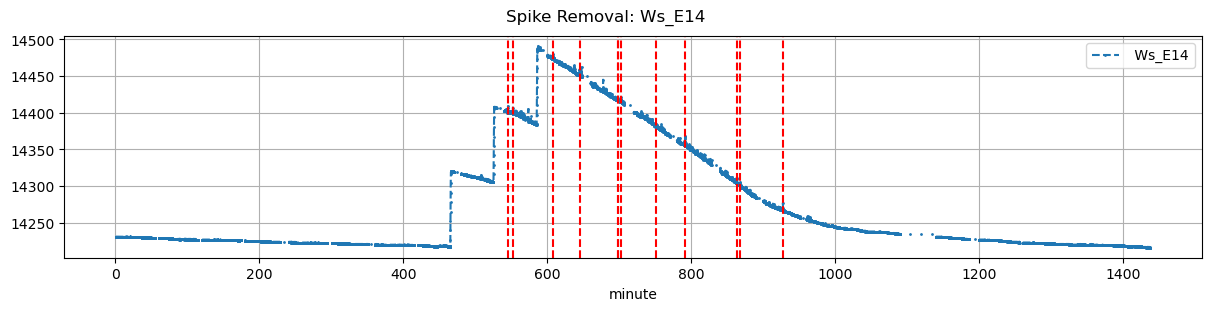
Ws_E14 |
0.388222 |
30 |
465.0 |
465.250000 |
465.62 |
466.5 |
NaN |
NaN |
NaN |
14218.0 |
14320.0 |
37 |
-0.007062 |
NaN |
-0.017778 |
0.410000 |
0.551351 |
20.4 |
15.0 |
52.8 |
20.4 |
0.0 |
0.141345 |
NaN |
0.141345 |
| 2025-12-08 08:45:00+08:00 |
63 |
525 |
Ws_E14 |
0.388222 |
30 |
525.0 |
525.250000 |
525.62 |
526.5 |
NaN |
NaN |
NaN |
14306.0 |
14408.0 |
37 |
-0.021914 |
NaN |
-0.029514 |
0.404286 |
0.551351 |
20.4 |
15.0 |
52.8 |
20.4 |
0.0 |
0.038918 |
NaN |
0.038918 |
| 2025-12-08 09:45:00+08:00 |
63 |
585 |
Ws_E14 |
0.388222 |
30 |
585.0 |
585.166667 |
585.62 |
586.5 |
NaN |
NaN |
NaN |
14385.0 |
14491.0 |
37 |
-0.038766 |
NaN |
-0.056528 |
0.401143 |
0.572973 |
21.2 |
10.0 |
52.8 |
21.2 |
0.0 |
-0.257025 |
NaN |
-0.257025 |