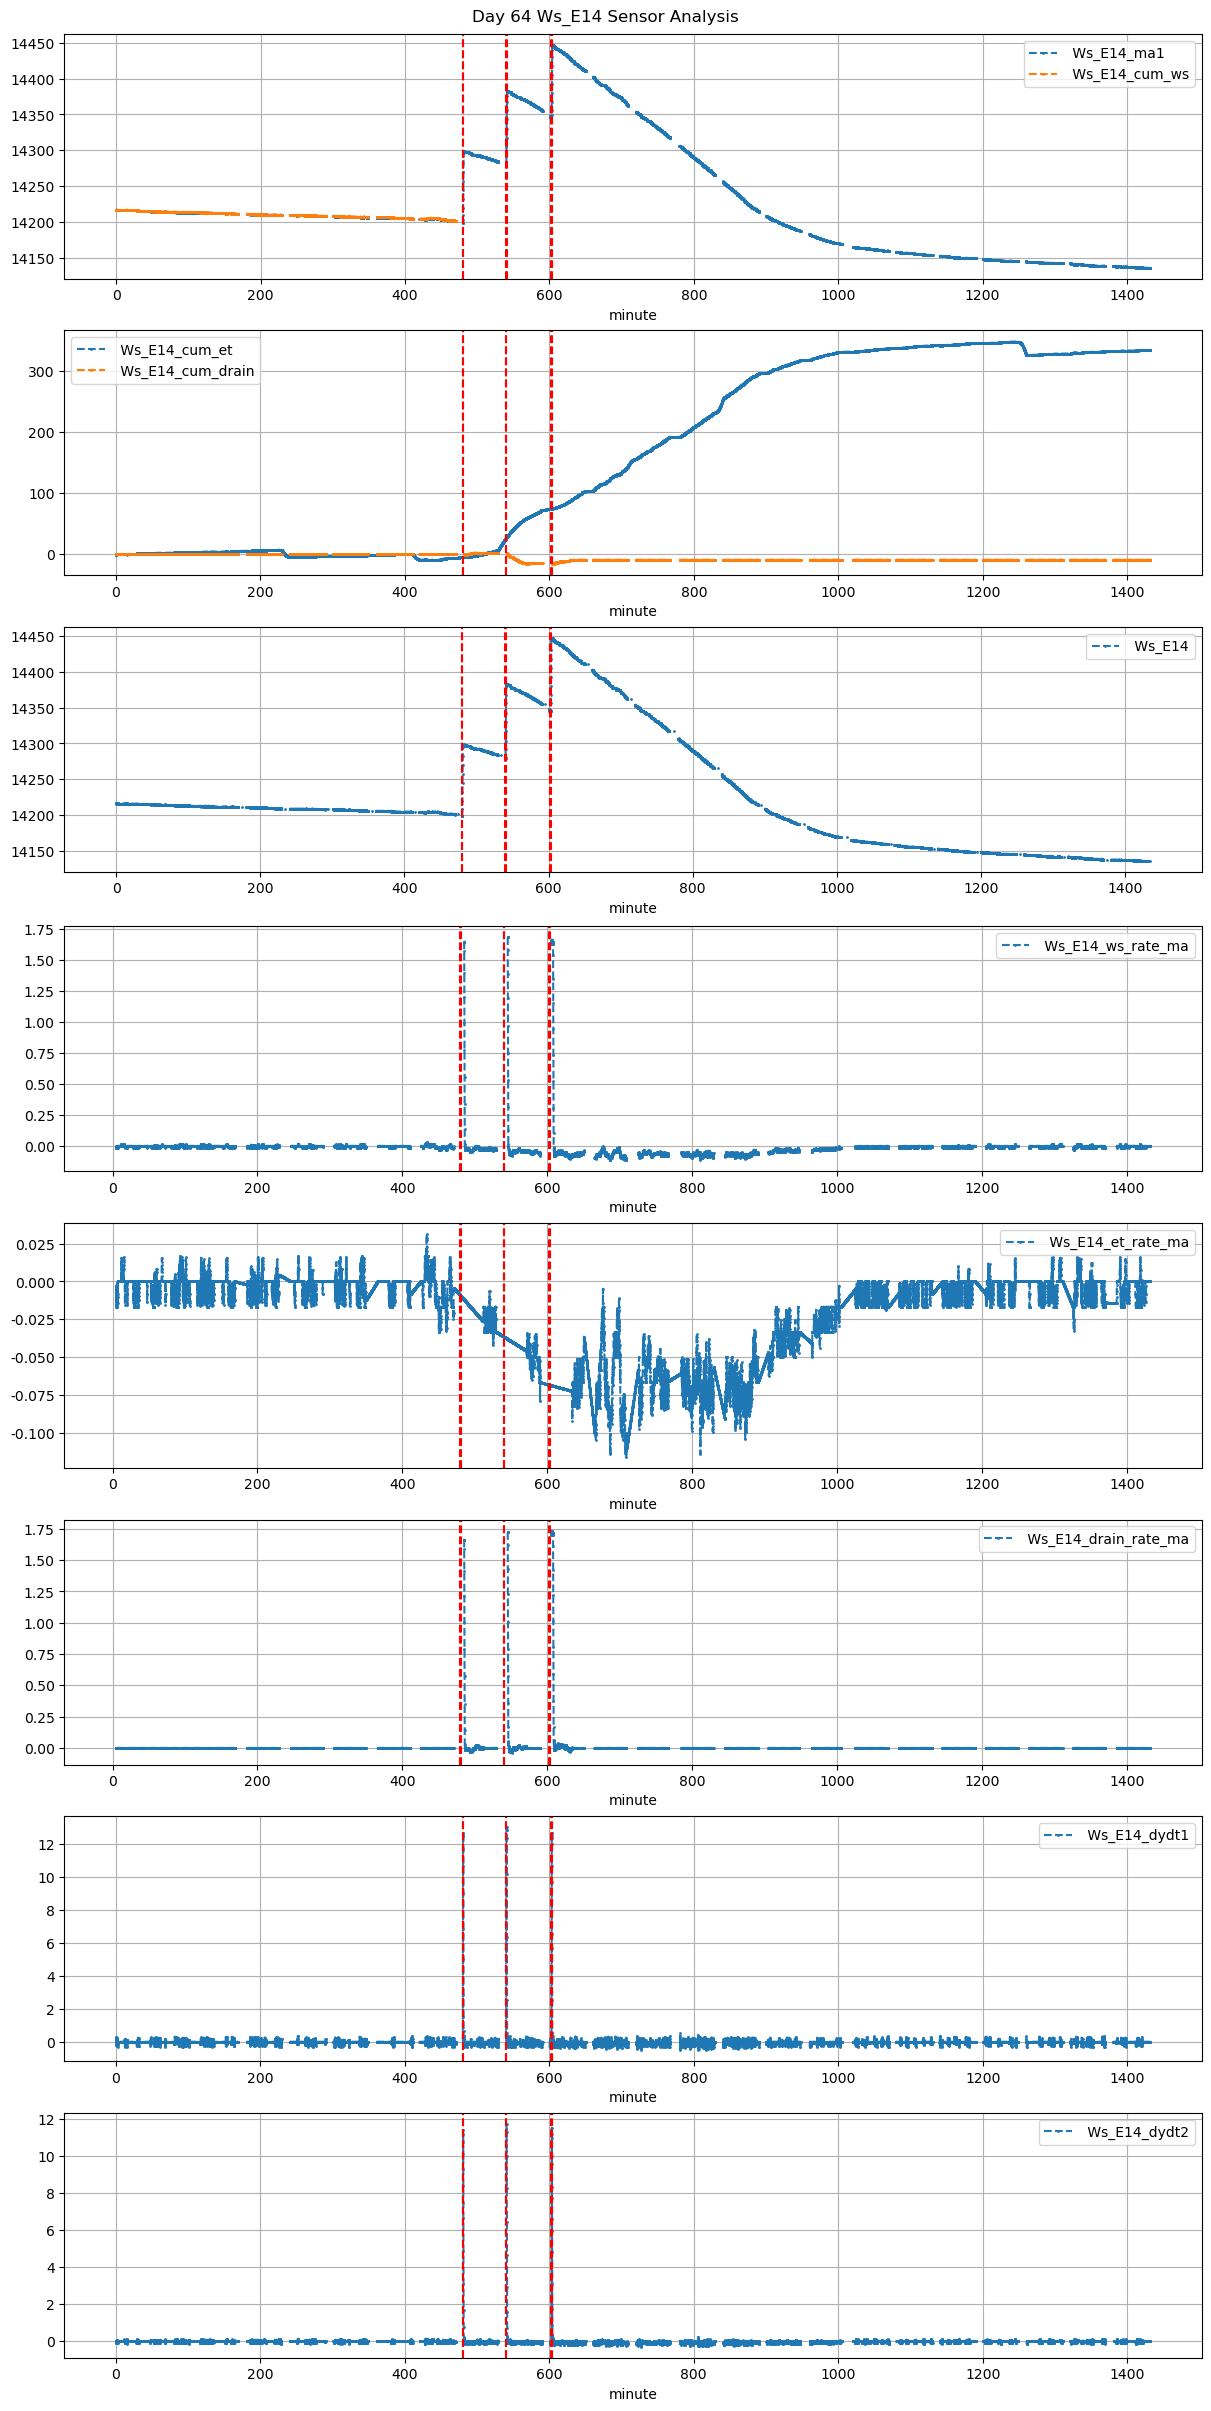
| 2025-12-09 08:00:00+08:00 |
64 |
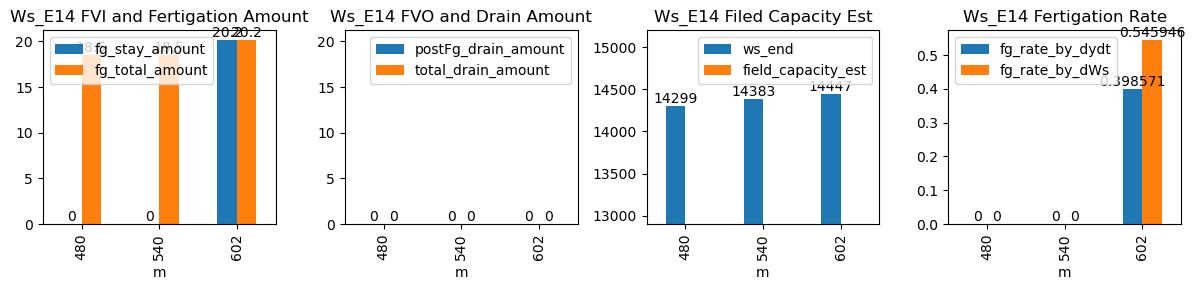
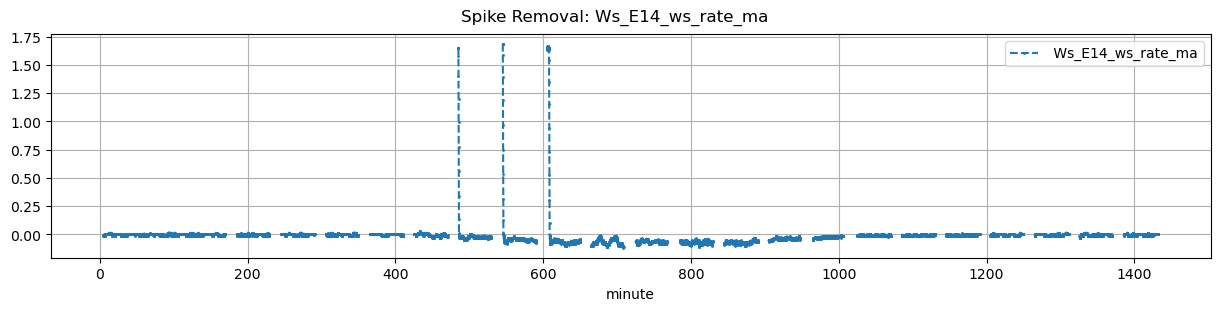
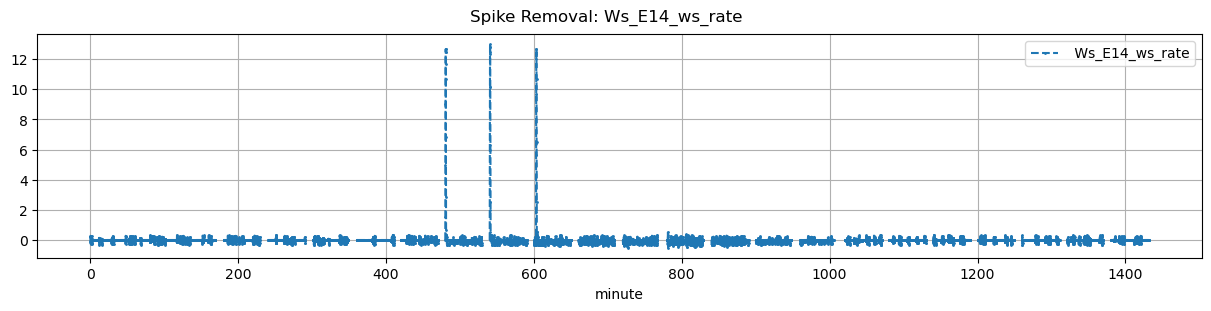
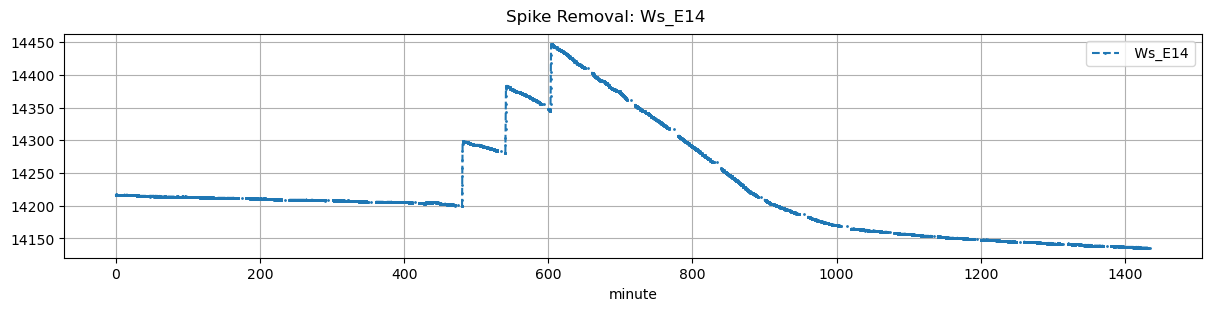
480 |
Ws_E14 |
0.232196 |
30 |
480.0 |
NaN |
480.62 |
481.500000 |
NaN |
NaN |
NaN |
NaN |
14299.0 |
37 |
NaN |
-0.027083 |
-0.026435 |
NaN |
NaN |
NaN |
NaN |
52.8 |
18.5 |
NaN |
NaN |
NaN |
NaN |
| 2025-12-09 09:00:00+08:00 |
64 |
540 |
Ws_E14 |
0.232196 |
30 |
540.0 |
NaN |
540.62 |
541.583333 |
NaN |
NaN |
NaN |
NaN |
14383.0 |
37 |
NaN |
-0.063194 |
-0.045913 |
NaN |
NaN |
NaN |
NaN |
57.8 |
18.5 |
NaN |
NaN |
NaN |
NaN |
| 2025-12-09 10:02:36+08:00 |
64 |
602 |
Ws_E14 |
0.232196 |
30 |
602.6 |
602.916667 |
603.22 |
604.166667 |
NaN |
NaN |
NaN |
14346.0 |
14447.0 |
37 |
NaN |
-0.064444 |
-0.072320 |
0.398571 |
0.545946 |
20.2 |
19.0 |
56.8 |
20.2 |
0.0 |
NaN |
NaN |
NaN |