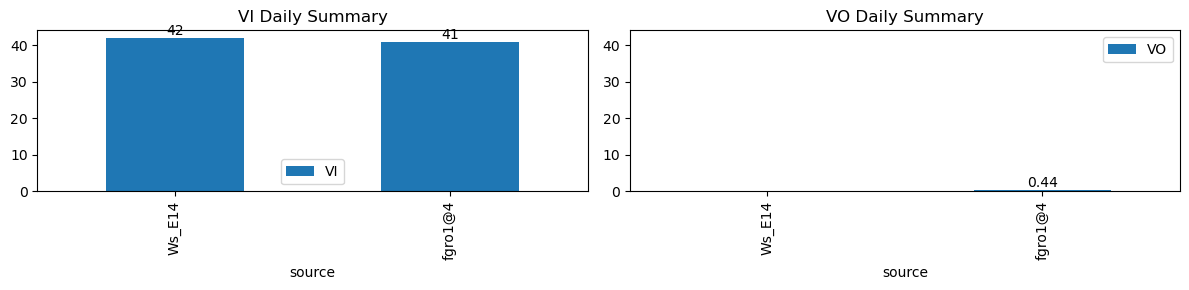
VI and VO Daily Summary
| ws_name | total_dp | nan_dp | nan_filled_dp | long_gap_dp | num_spike |
|---|---|---|---|---|---|
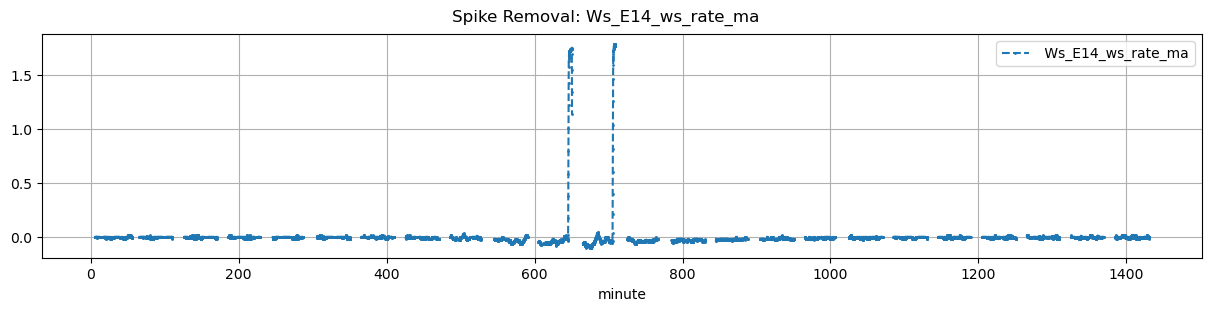
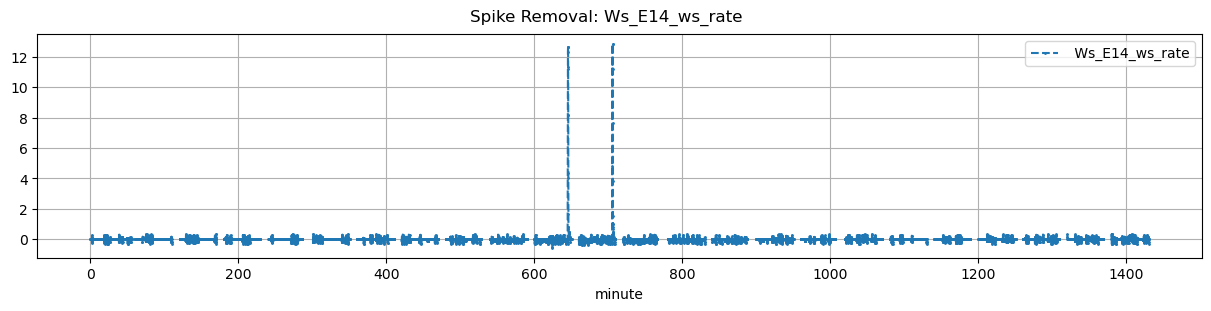
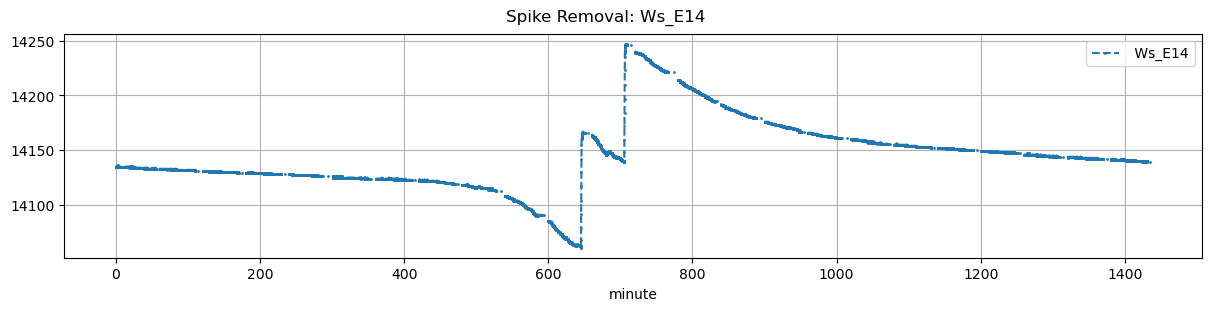
| Ws_E14 | 17217 | 2872 | 11936 | 2872 | 0 |
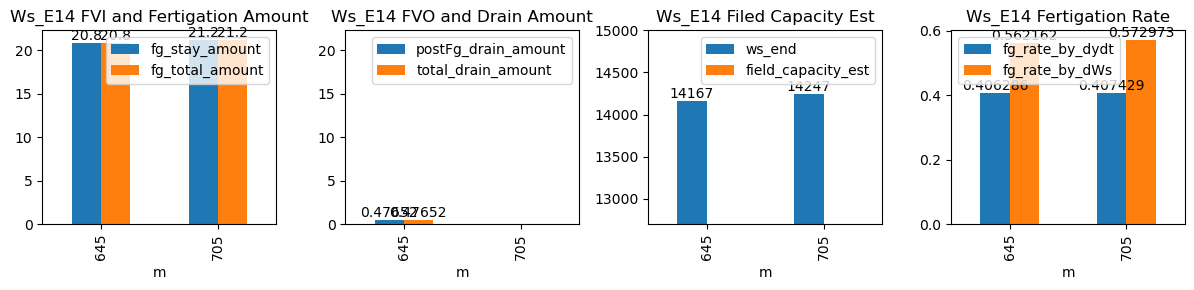
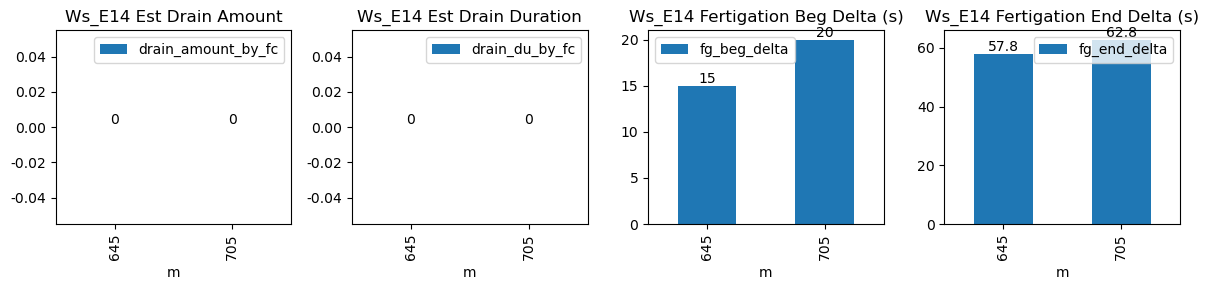
| ds | d | m | ws_name | prominence_cut | max_drain_du | fg_beg | fg_beg_est | fg_end | fg_end_est | drain_amount_by_fc | drain_du_by_fc | drain_rate_by_fc | ws_beg | ws_end | duc | pre_fg_et | post_fg_ws | post_drn_et | fg_rate_by_dydt | fg_rate_by_dWs | fg_stay_amount | fg_beg_delta | fg_end_delta | fg_total_amount | fg_drain_amount | postFg_drain_amount | field_capacity_est | total_drain_amount |
|---|---|---|---|---|---|---|---|---|---|---|---|---|---|---|---|---|---|---|---|---|---|---|---|---|---|---|---|---|
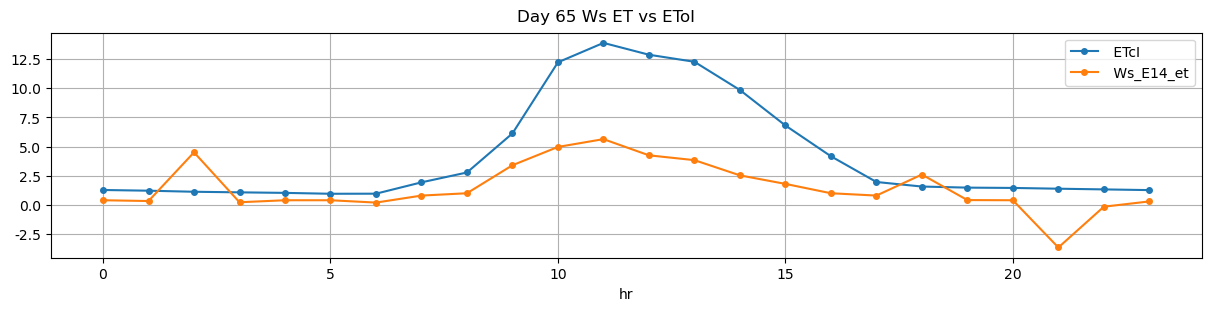
| 2025-12-10 10:45:00+08:00 | 65 | 645 | Ws_E14 | 0.176056 | 30 | 645.0 | 645.250000 | 645.62 | 646.583333 | NaN | NaN | NaN | 14063.0 | 14167.0 | 37 | -0.005869 | NaN | -0.068472 | 0.406286 | 0.562162 | 20.8 | 15.0 | 57.8 | 20.8 | 0.0 | 0.476520 | NaN | 0.476520 |
| 2025-12-10 11:45:00+08:00 | 65 | 705 | Ws_E14 | 0.176056 | 30 | 705.0 | 705.333333 | 705.62 | 706.666667 | NaN | NaN | NaN | 14141.0 | 14247.0 | 37 | -0.045276 | NaN | -0.046250 | 0.407429 | 0.572973 | 21.2 | 20.0 | 62.8 | 21.2 | 0.0 | -1.177844 | NaN | -1.177844 |