| 2025-12-11 09:45:00+08:00 |
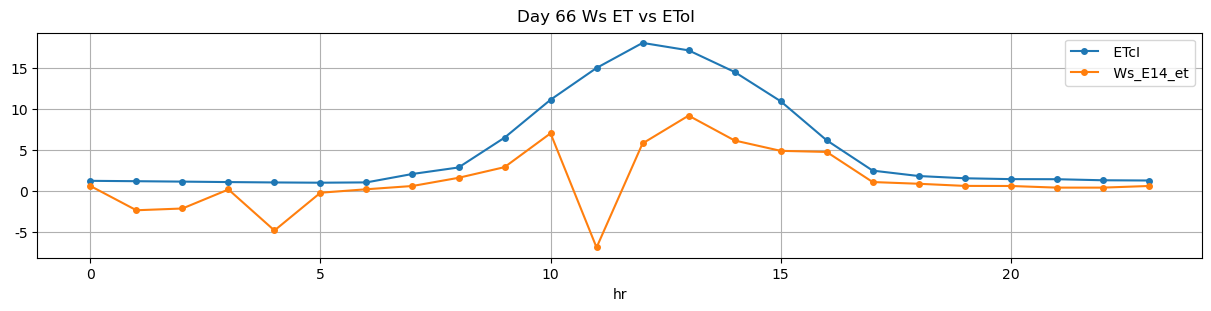
66 |
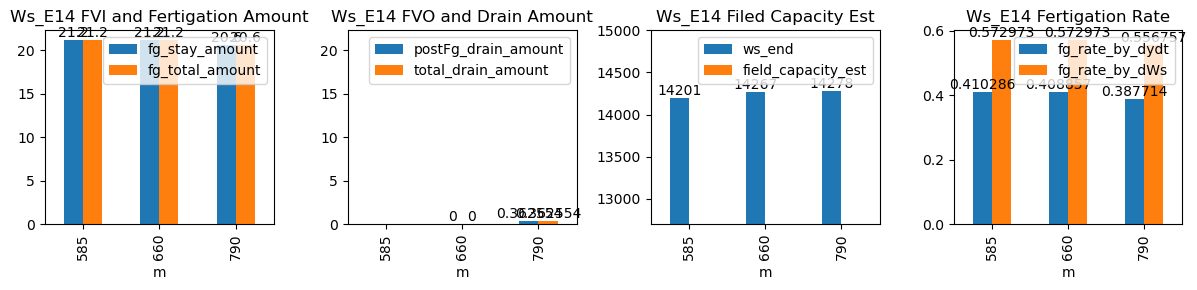
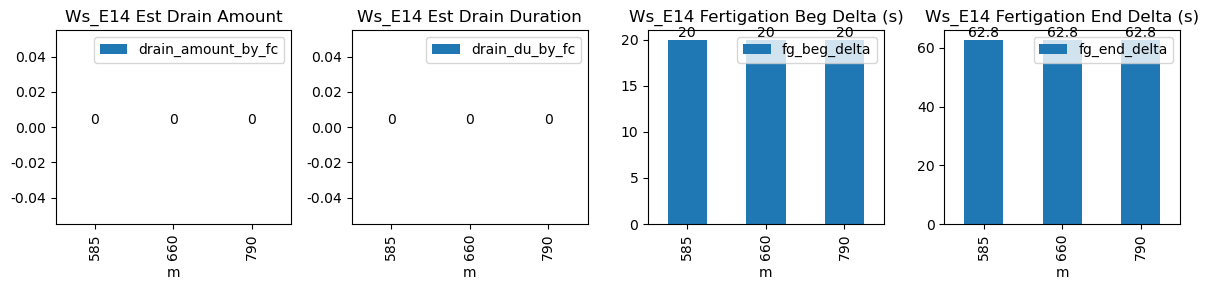
585 |
Ws_E14 |
0.47951 |
30 |
585.0 |
585.333333 |
585.62 |
586.666667 |
NaN |
NaN |
NaN |
14095.0 |
14201.0 |
37 |
-0.016102 |
NaN |
-0.058056 |
0.410286 |
0.572973 |
21.2 |
20.0 |
62.8 |
21.2 |
0.0 |
-0.540083 |
NaN |
-0.540083 |
| 2025-12-11 11:00:00+08:00 |
66 |
660 |
Ws_E14 |
0.47951 |
30 |
660.0 |
660.333333 |
660.62 |
661.666667 |
NaN |
NaN |
NaN |
14161.0 |
14267.0 |
37 |
-0.048305 |
NaN |
NaN |
0.408857 |
0.572973 |
21.2 |
20.0 |
62.8 |
21.2 |
0.0 |
NaN |
NaN |
NaN |
| 2025-12-11 13:10:00+08:00 |
66 |
790 |
Ws_E14 |
0.47951 |
30 |
790.0 |
790.333333 |
790.62 |
791.666667 |
NaN |
NaN |
NaN |
14175.0 |
14278.0 |
37 |
-0.053713 |
-0.063611 |
-0.068472 |
0.387714 |
0.556757 |
20.6 |
20.0 |
62.8 |
20.6 |
0.0 |
0.362554 |
NaN |
0.362554 |