| 2025-12-01 09:05:00+08:00 |
56 |
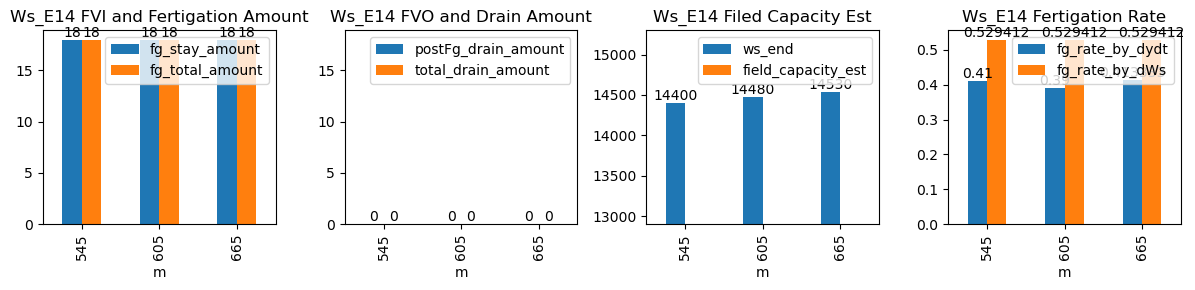
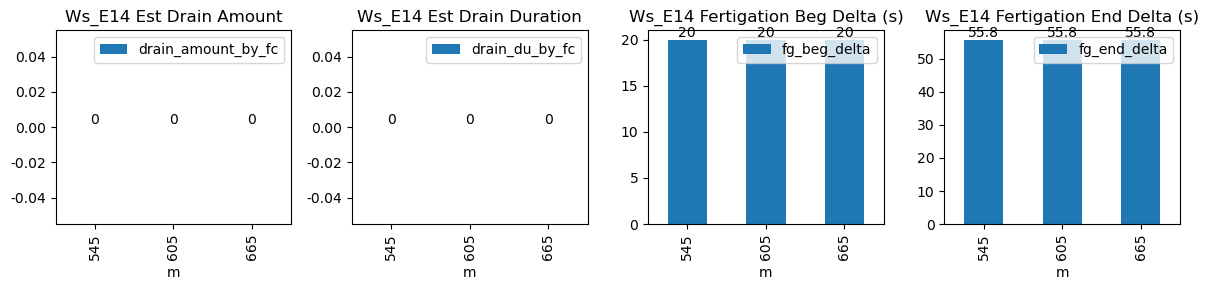
545 |
Ws_E14 |
0.818062 |
30 |
545.0 |
545.333333 |
545.57 |
546.5 |
NaN |
NaN |
NaN |
14310.0 |
14400.0 |
34 |
NaN |
0.000000 |
-0.162500 |
0.410000 |
0.529412 |
18.0 |
20.0 |
55.8 |
18.0 |
0.0 |
NaN |
NaN |
NaN |
| 2025-12-01 10:05:00+08:00 |
56 |
605 |
Ws_E14 |
0.818062 |
30 |
605.0 |
605.333333 |
605.57 |
606.5 |
NaN |
NaN |
NaN |
14390.0 |
14480.0 |
34 |
NaN |
-0.050000 |
-0.129514 |
0.390000 |
0.529412 |
18.0 |
20.0 |
55.8 |
18.0 |
0.0 |
NaN |
NaN |
NaN |
| 2025-12-01 11:05:00+08:00 |
56 |
665 |
Ws_E14 |
0.818062 |
30 |
665.0 |
665.333333 |
665.57 |
666.5 |
NaN |
NaN |
NaN |
14440.0 |
14530.0 |
34 |
NaN |
-0.040278 |
-0.065278 |
0.413333 |
0.529412 |
18.0 |
20.0 |
55.8 |
18.0 |
0.0 |
NaN |
NaN |
NaN |