| 2025-12-02 09:20:00+08:00 |
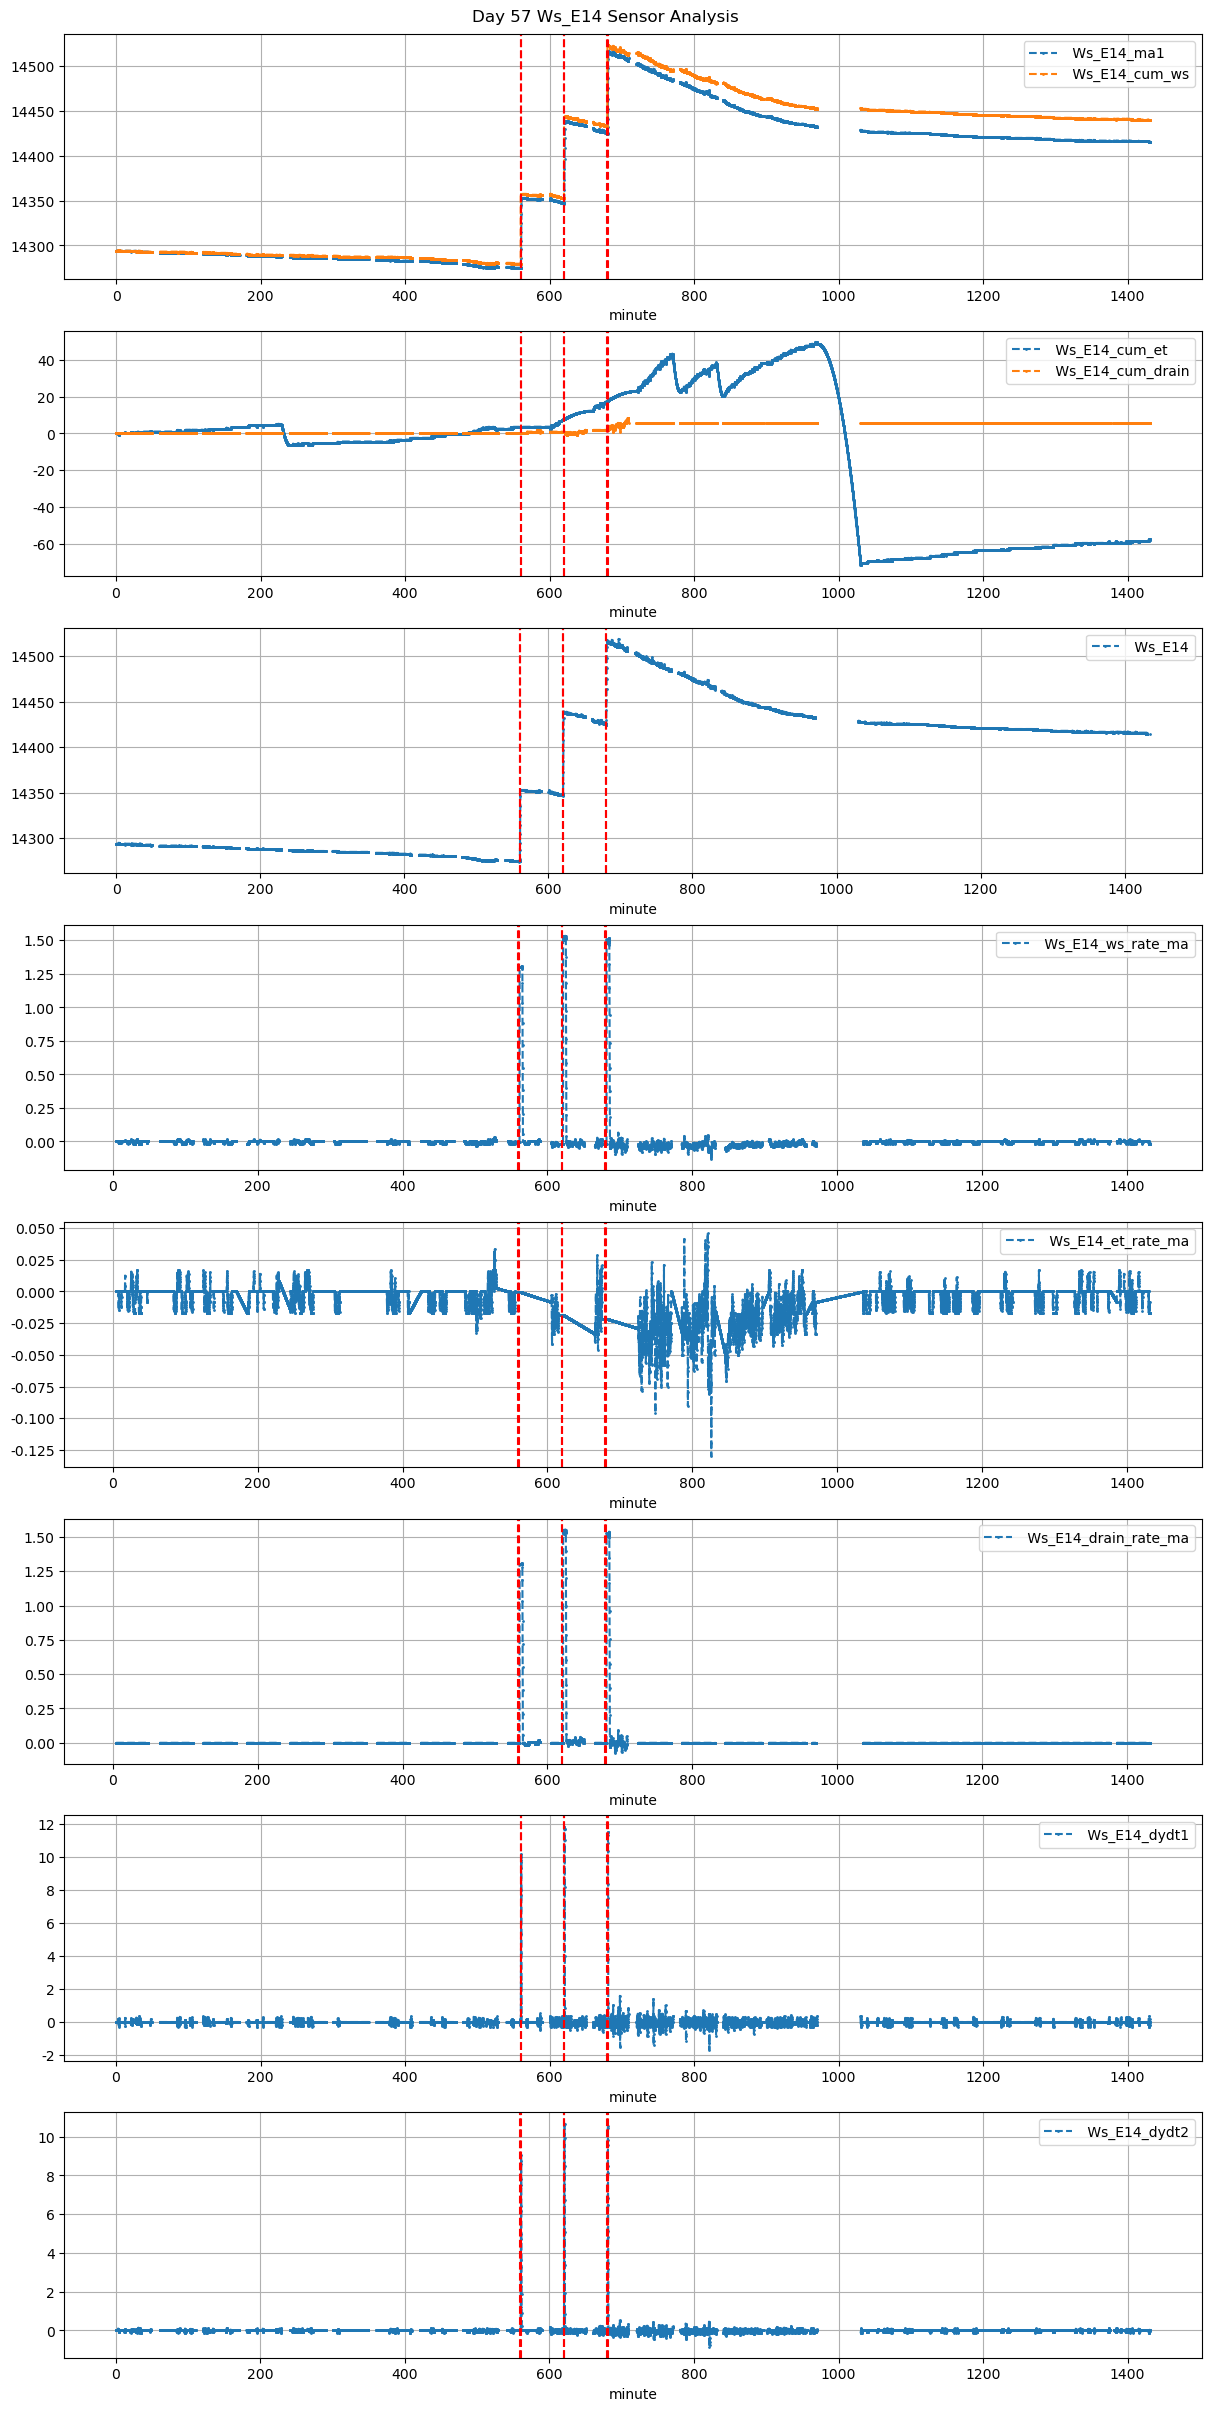
57 |
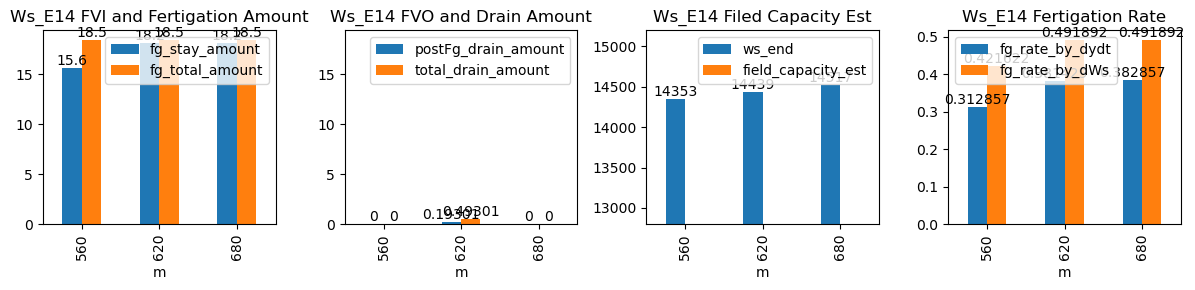
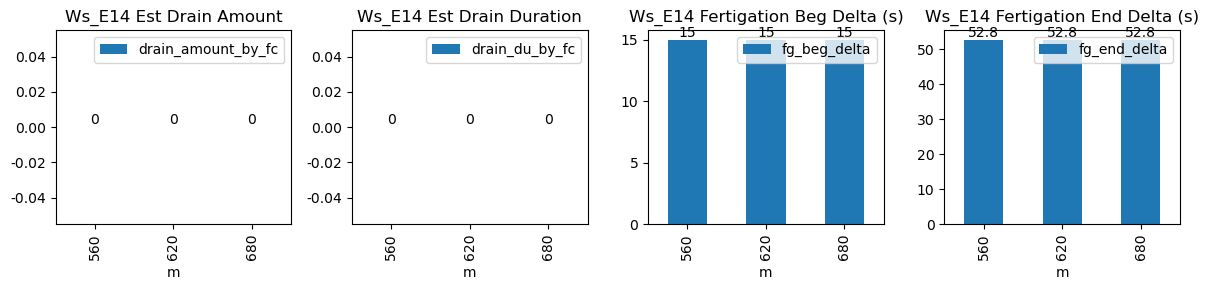
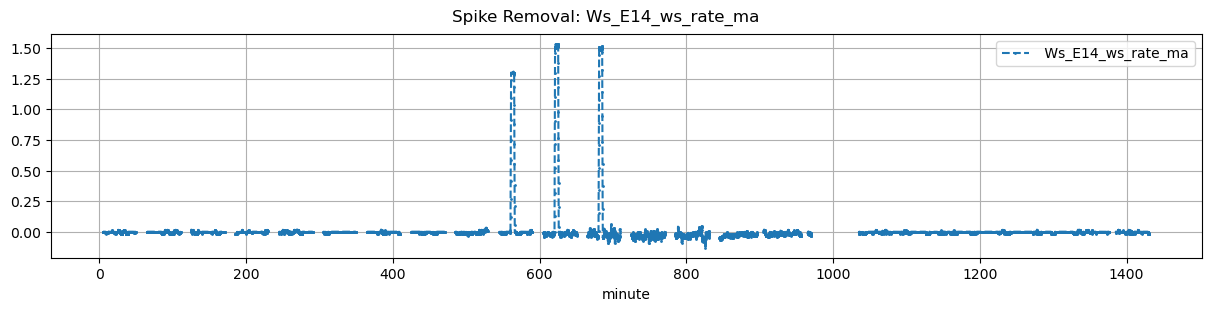
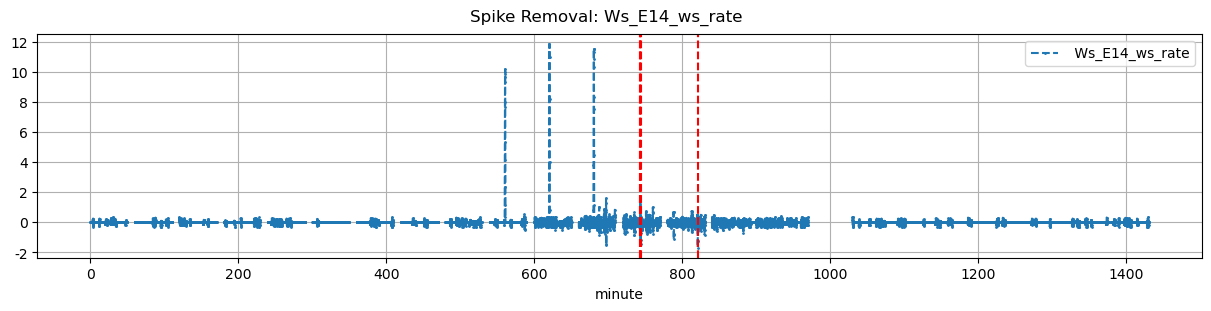
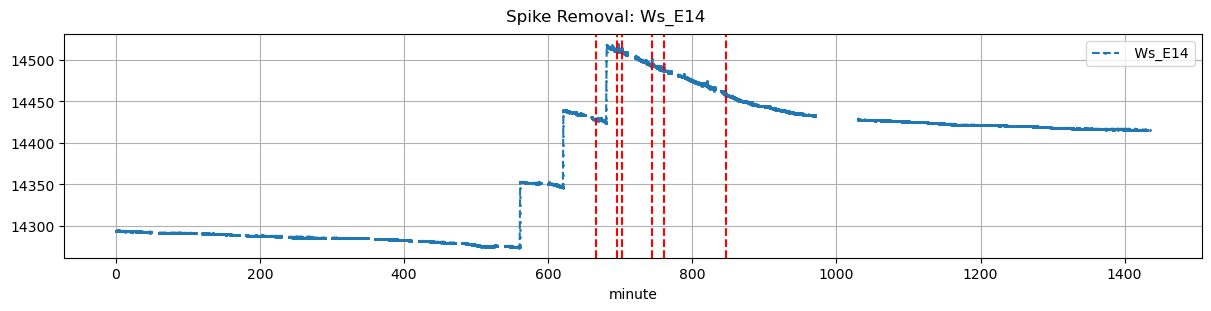
560 |
Ws_E14 |
0.220618 |
30 |
560.0 |
560.25 |
560.62 |
561.5 |
NaN |
NaN |
NaN |
14275.0 |
14353.0 |
37 |
-0.000282 |
-0.009583 |
NaN |
0.312857 |
0.421622 |
15.6 |
15.0 |
52.8 |
18.5 |
2.9 |
NaN |
NaN |
NaN |
| 2025-12-02 10:20:00+08:00 |
57 |
620 |
Ws_E14 |
0.220618 |
30 |
620.0 |
620.25 |
620.62 |
621.5 |
NaN |
NaN |
NaN |
14348.0 |
14439.0 |
37 |
-0.019633 |
-0.018472 |
NaN |
0.381429 |
0.491892 |
18.2 |
15.0 |
52.8 |
18.5 |
0.3 |
0.19301 |
NaN |
0.49301 |
| 2025-12-02 11:20:00+08:00 |
57 |
680 |
Ws_E14 |
0.220618 |
30 |
680.0 |
680.25 |
680.62 |
681.5 |
NaN |
NaN |
NaN |
14426.0 |
14517.0 |
37 |
-0.028390 |
-0.021528 |
NaN |
0.382857 |
0.491892 |
18.2 |
15.0 |
52.8 |
18.5 |
0.3 |
NaN |
NaN |
NaN |