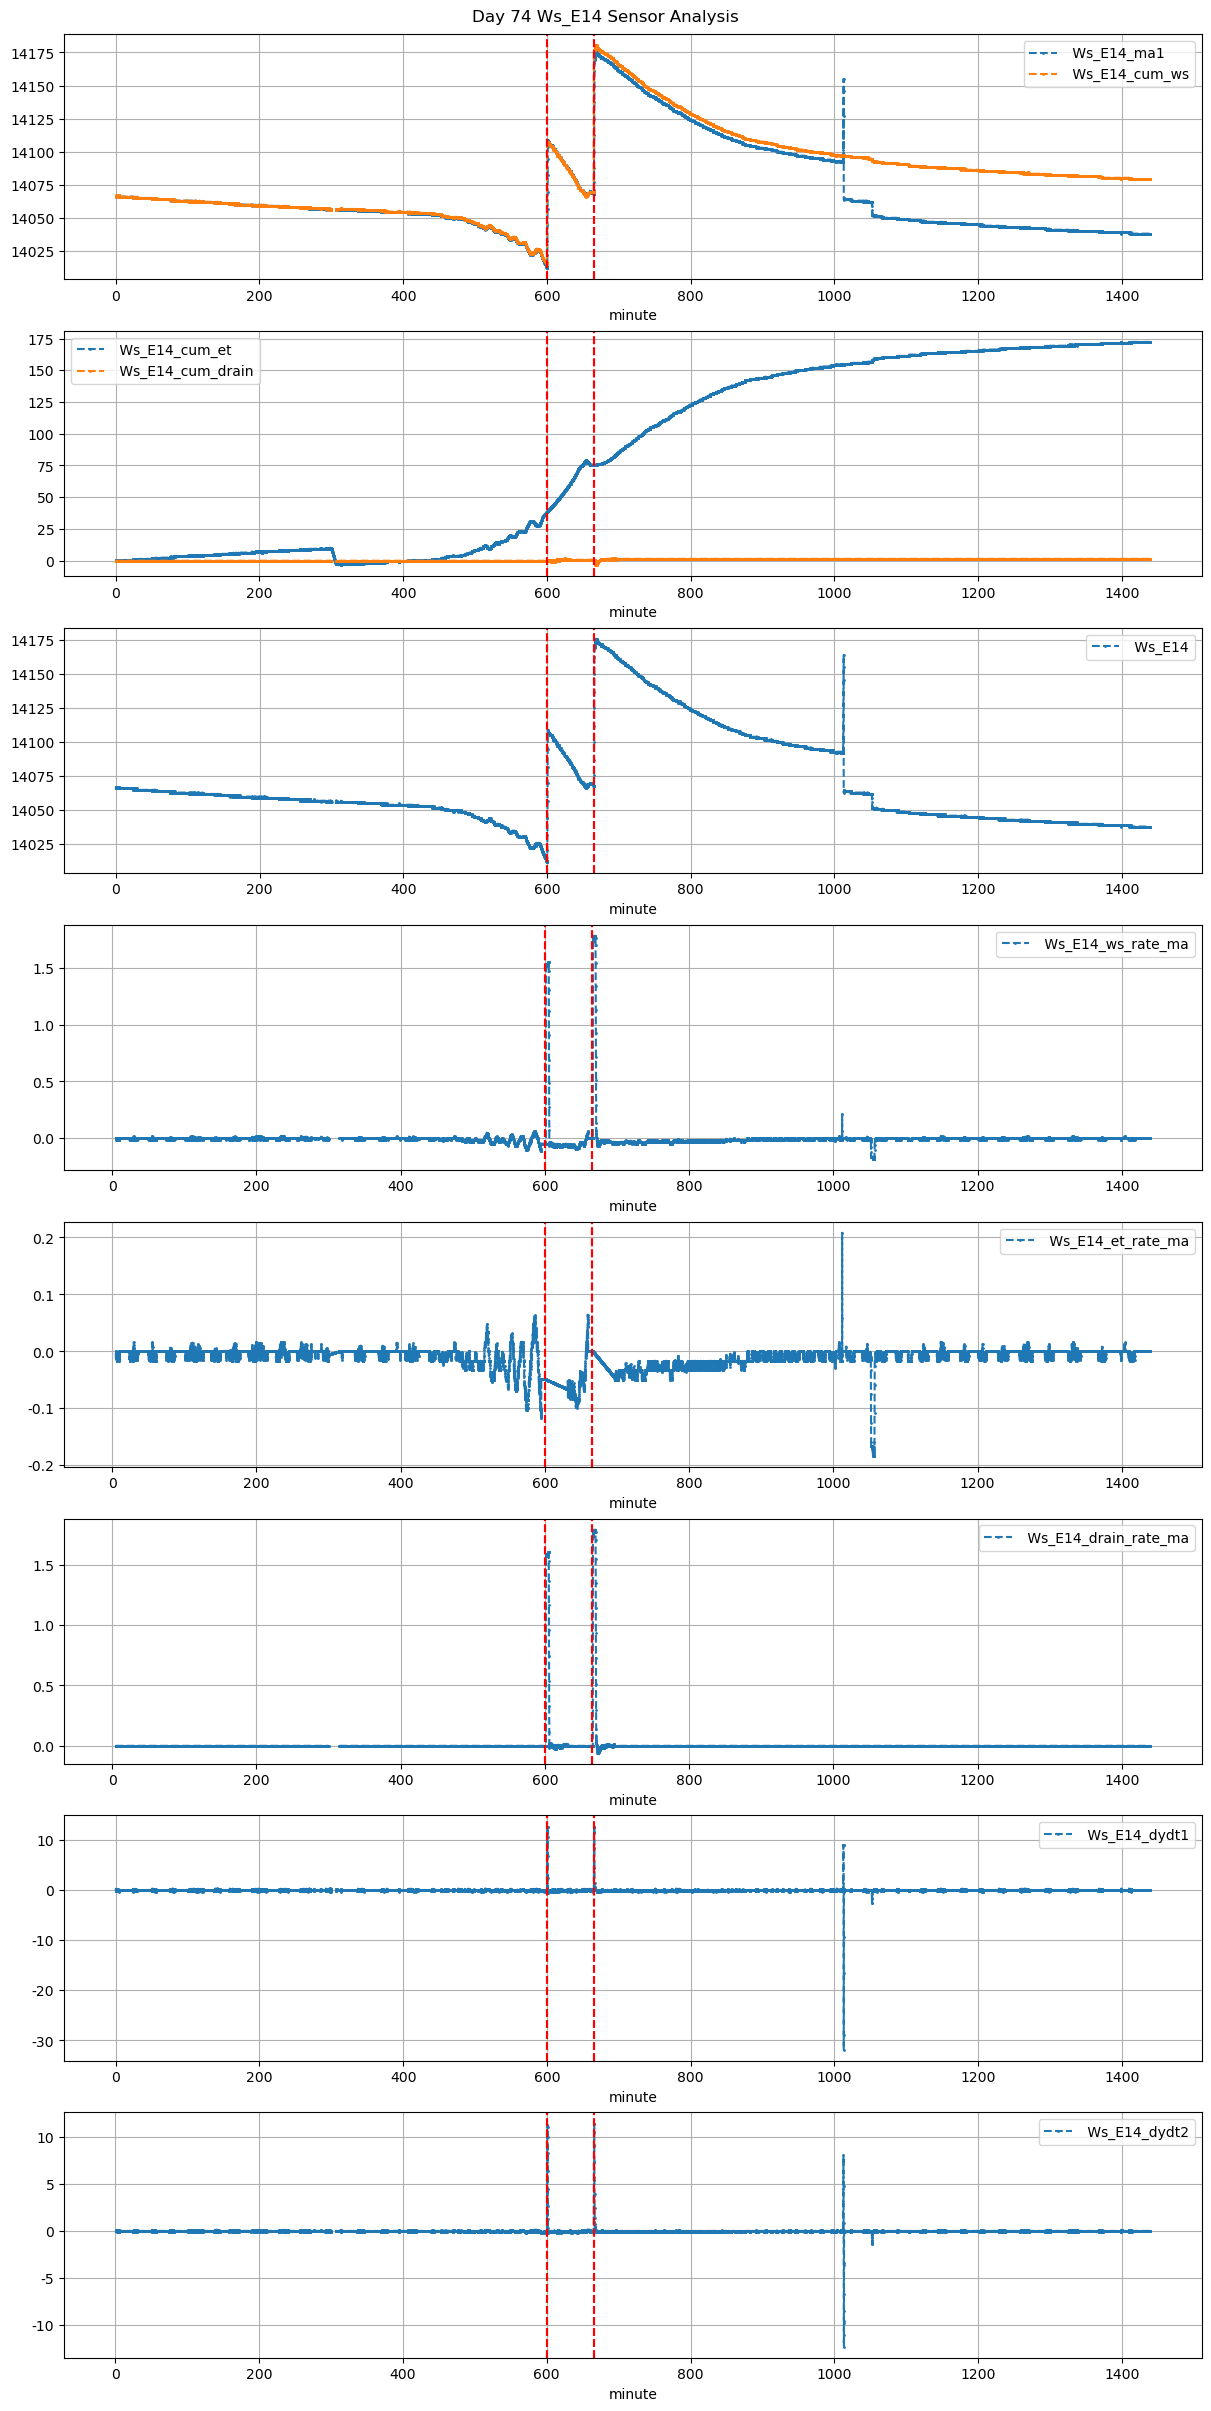
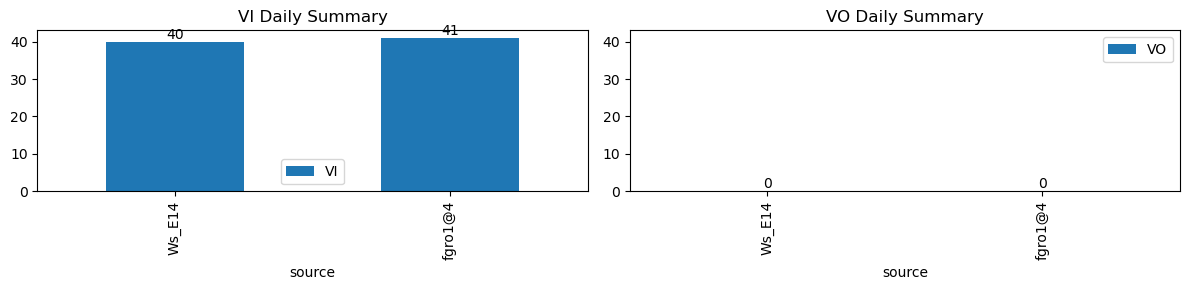
VI and VO Daily Summary
| ws_name | total_dp | nan_dp | nan_filled_dp | long_gap_dp | num_spike |
|---|---|---|---|---|---|
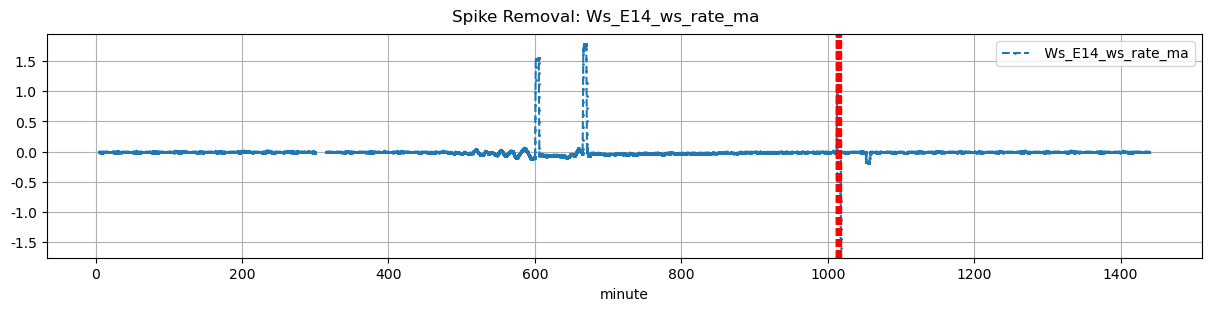
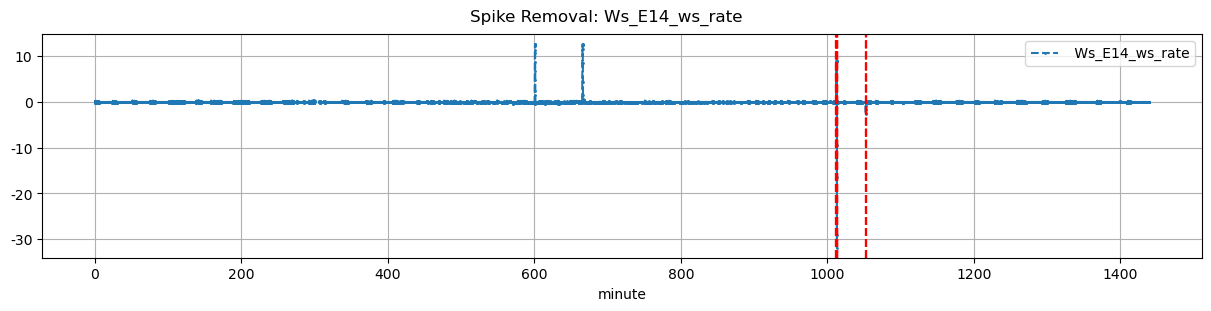
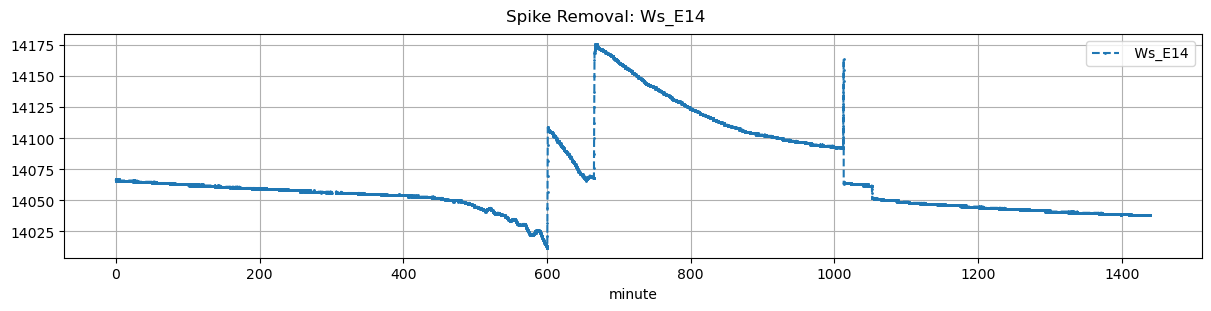
| Ws_E14 | 17270 | 98 | 14426 | 98 | 0 |
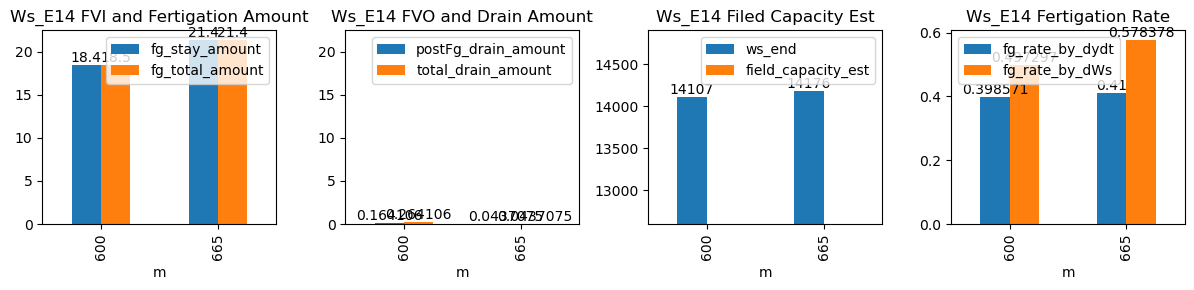
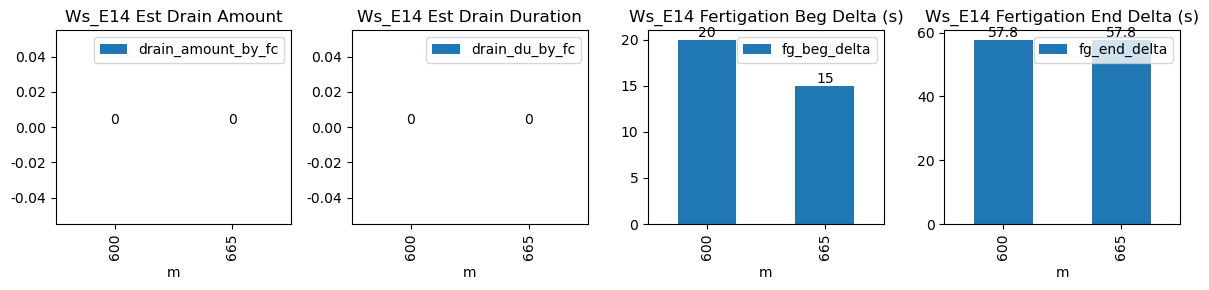
| ds | d | m | ws_name | prominence_cut | max_drain_du | fg_beg | fg_beg_est | fg_end | fg_end_est | drain_amount_by_fc | drain_du_by_fc | drain_rate_by_fc | ws_beg | ws_end | duc | pre_fg_et | post_fg_ws | post_drn_et | fg_rate_by_dydt | fg_rate_by_dWs | fg_stay_amount | fg_beg_delta | fg_end_delta | fg_total_amount | fg_drain_amount | postFg_drain_amount | field_capacity_est | total_drain_amount |
|---|---|---|---|---|---|---|---|---|---|---|---|---|---|---|---|---|---|---|---|---|---|---|---|---|---|---|---|---|
| 2025-12-19 10:00:00+08:00 | 74 | 600 | Ws_E14 | 1.012165 | 30 | 600.0 | 600.333333 | 600.62 | 601.583333 | NaN | NaN | NaN | 14015.0 | 14107.0 | 37 | -0.106073 | -0.049306 | -0.066481 | 0.398571 | 0.497297 | 18.4 | 20.0 | 57.8 | 18.5 | 0.1 | 0.164106 | NaN | 0.264106 |
| 2025-12-19 11:05:00+08:00 | 74 | 665 | Ws_E14 | 1.012165 | 30 | 665.0 | 665.250000 | 665.62 | 666.583333 | NaN | NaN | NaN | 14069.0 | 14176.0 | 37 | 0.000000 | -0.047917 | -0.045732 | 0.410000 | 0.578378 | 21.4 | 15.0 | 57.8 | 21.4 | 0.0 | 0.043708 | NaN | 0.043708 |