| 2026-01-08 11:10:00+08:00 |
94 |
670 |
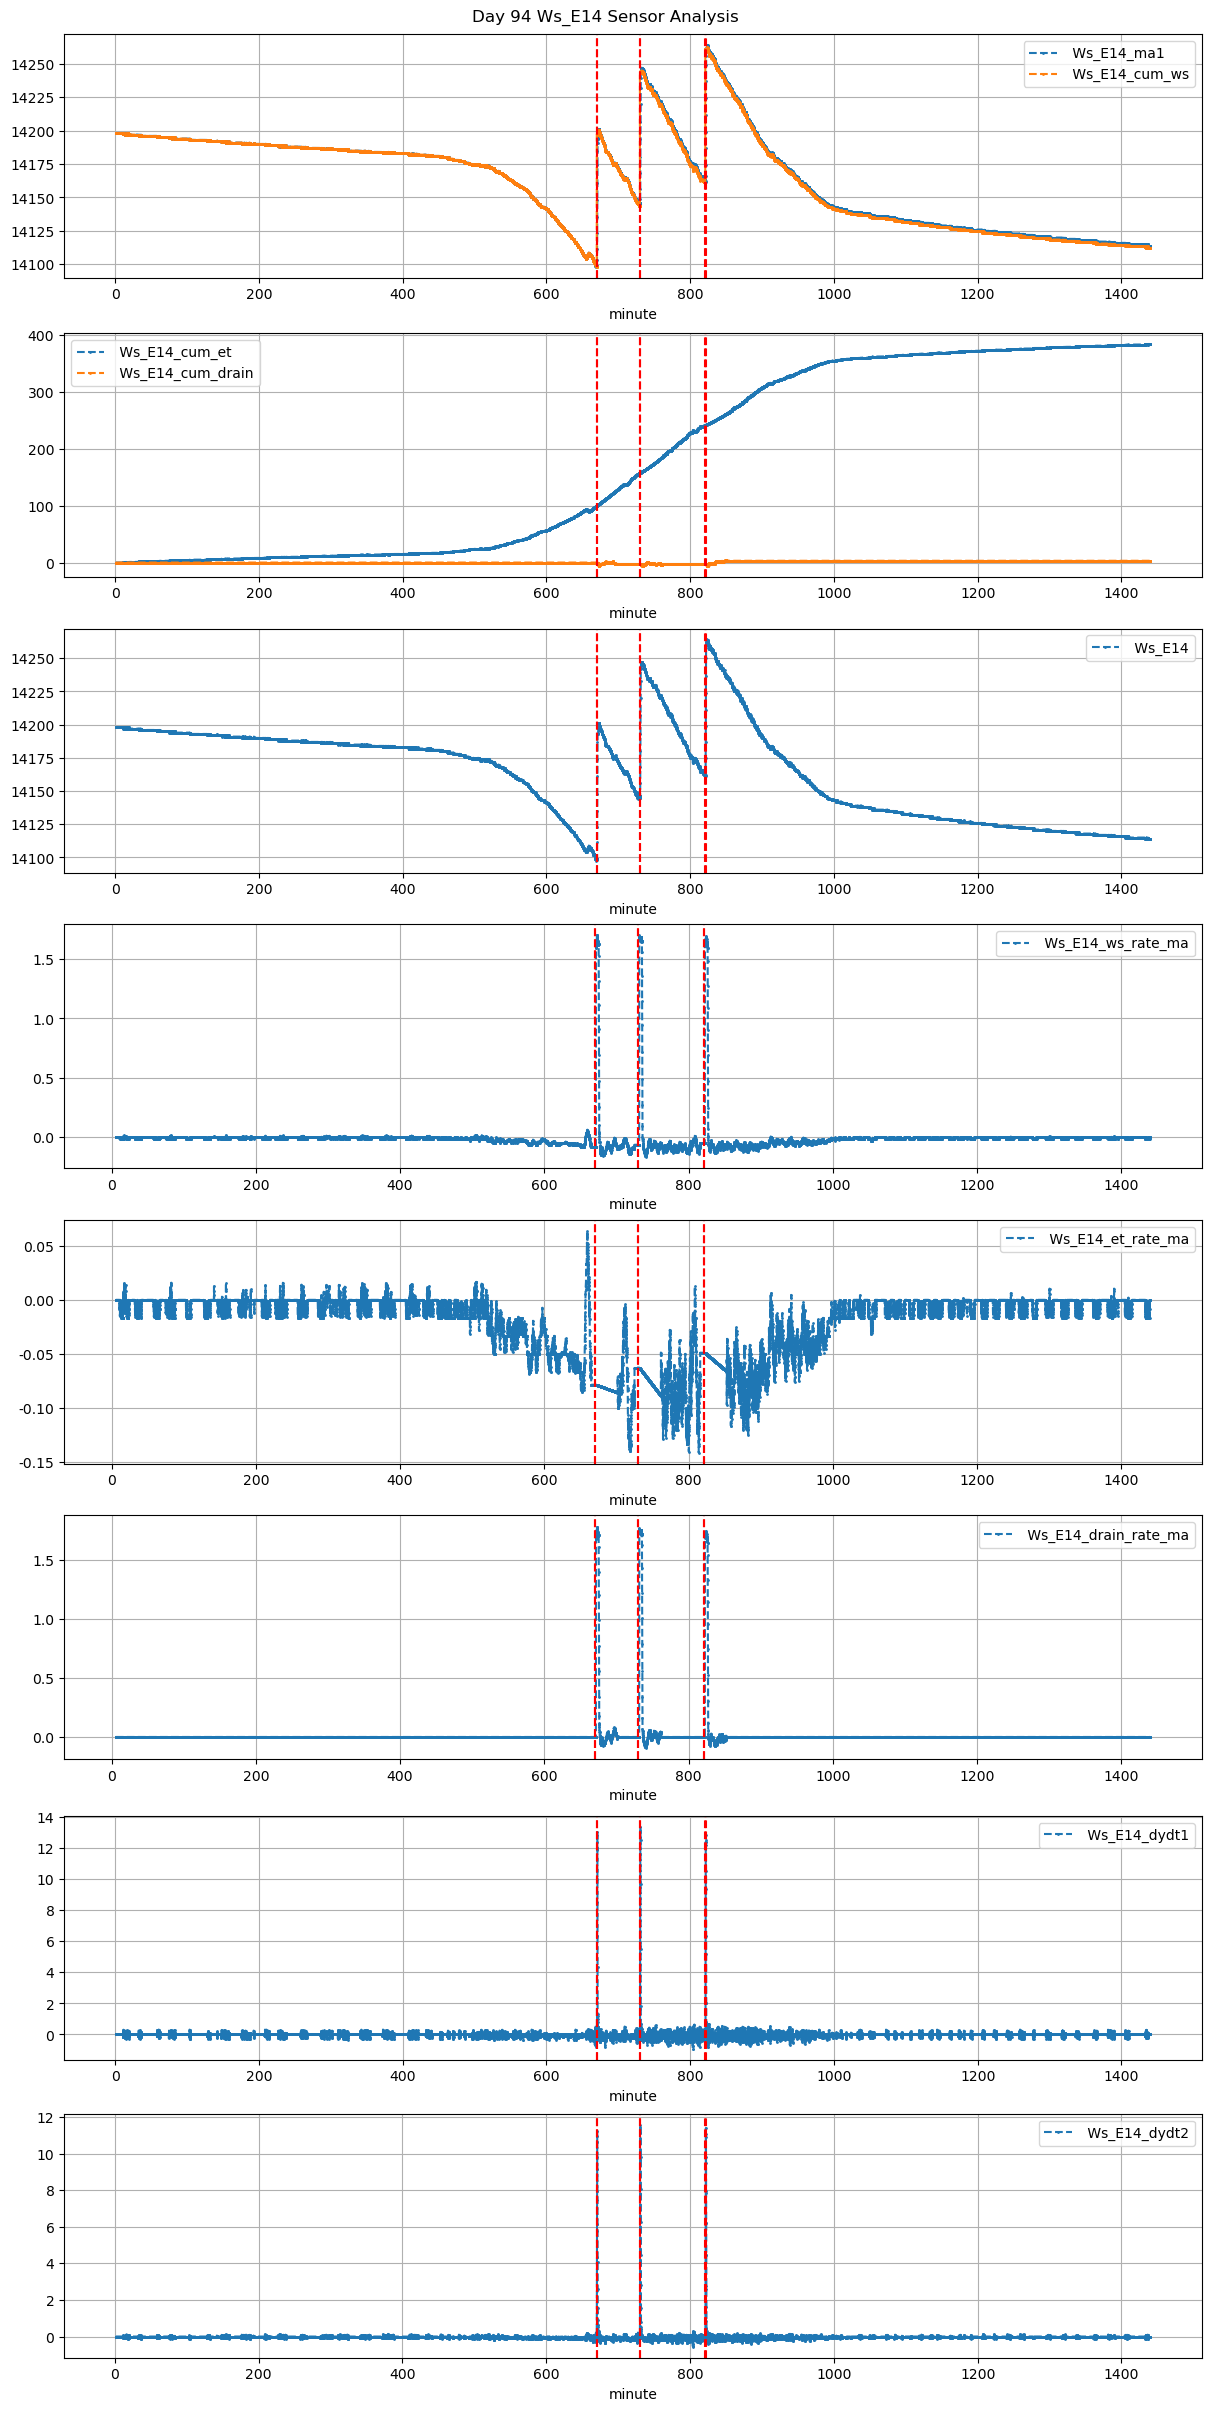
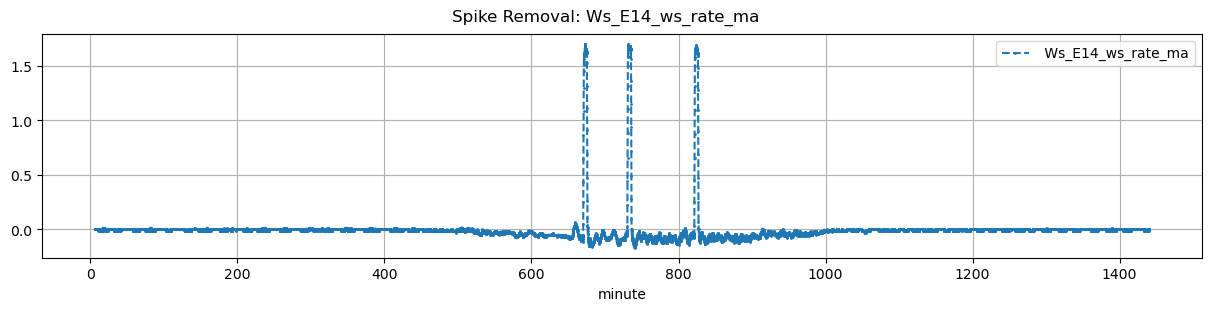
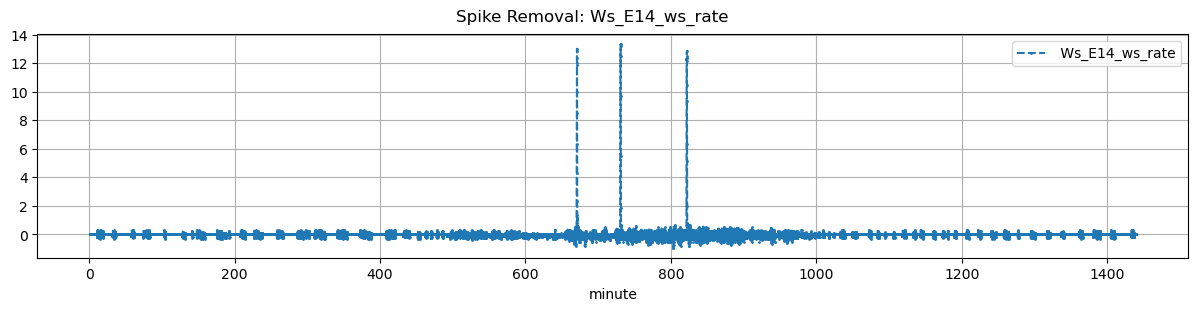
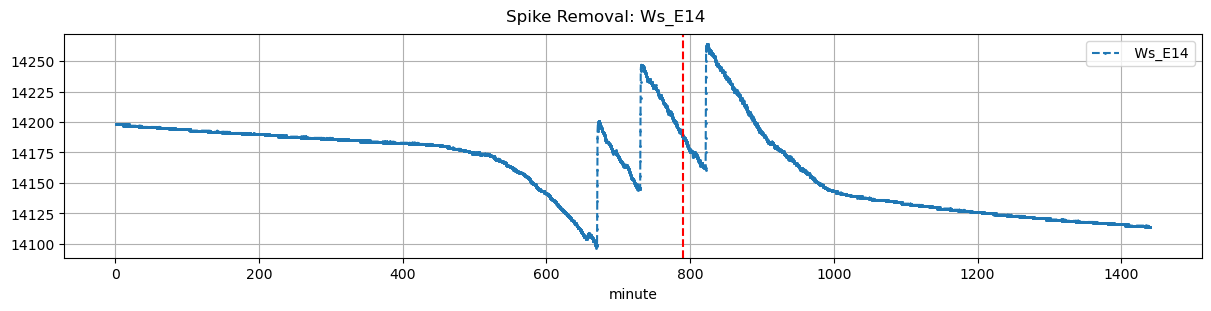
Ws_E14 |
0.281115 |
30 |
670.00 |
670.250000 |
670.58 |
671.583333 |
NaN |
NaN |
NaN |
14101.00 |
14201.0 |
35 |
-0.078590 |
-0.109583 |
-0.085903 |
0.387429 |
0.571429 |
20.00 |
15.0 |
60.2 |
20.00 |
0.0 |
-0.533019 |
NaN |
-0.533019 |
| 2026-01-08 12:10:00+08:00 |
94 |
730 |
Ws_E14 |
0.281115 |
30 |
730.00 |
730.333333 |
730.58 |
731.583333 |
NaN |
NaN |
NaN |
14146.00 |
14247.0 |
35 |
-0.062712 |
-0.120972 |
-0.088856 |
0.391429 |
0.577143 |
20.20 |
20.0 |
60.2 |
20.20 |
0.0 |
-0.228576 |
NaN |
-0.228576 |
| 2026-01-08 13:41:03+08:00 |
94 |
821 |
Ws_E14 |
0.281115 |
30 |
821.05 |
821.333333 |
821.63 |
822.666667 |
NaN |
NaN |
NaN |
14163.25 |
14264.0 |
35 |
-0.048981 |
-0.075000 |
-0.066157 |
0.390286 |
0.575714 |
20.15 |
17.0 |
62.2 |
20.15 |
0.0 |
1.249918 |
NaN |
1.249918 |