VI and VO Daily Summary
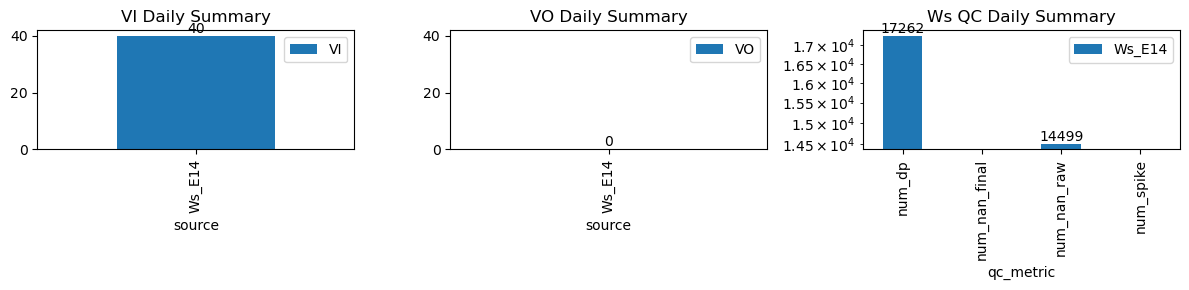
| ws_name | num_dp | num_nan_raw | num_nan_final | num_spike | cum_step_adj |
|---|---|---|---|---|---|
| Ws_E14 | 17,262 | 14,499 | 0 | 0 | 0.00 |
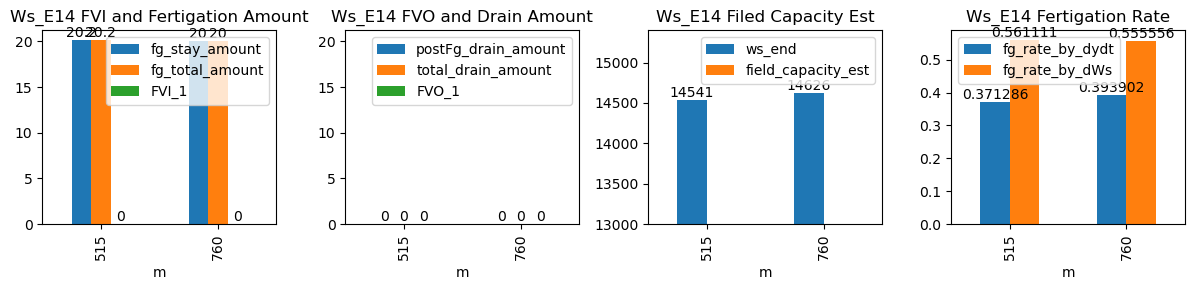
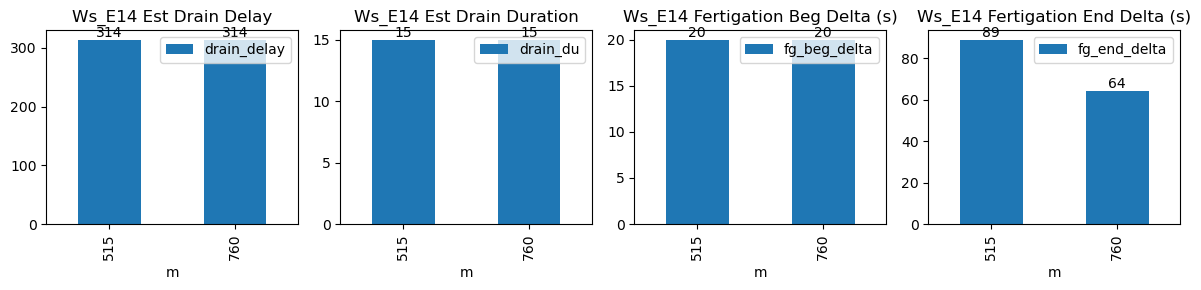
| ds | d | m | ws_name | prominence_cut | max_drain_du | fg_beg | fg_beg_est | fg_end | fg_end_est | ws_beg | ws_end | duc | pre_fg_et | post_fg_ws | post_drn_et | fg_rate_by_dydt | fg_rate_by_dWs | fg_stay_amount | enough_data | fg_beg_delta | fg_end_delta | fg_total_amount | fg_drain_amount | postFg_drain_amount | total_drain_amount | drain_du | drain_delay | drain_rate | field_capacity_est | FVI_1 | FVO_1 |
|---|---|---|---|---|---|---|---|---|---|---|---|---|---|---|---|---|---|---|---|---|---|---|---|---|---|---|---|---|---|---|---|
| 2026-01-19 08:35:00+08:00 | 105 | 515 | Ws_E14 | 0.138135 | 30 | 515.0 | 515.333333 | 515.6 | 517.083333 | 14440.0 | 14541.0 | 36 | 0.0 | -0.019625 | -0.004597 | 0.371286 | 0.561111 | 20.2 | True | 20.0 | 89.0 | 20.2 | 0.0 | 0 | 0.0 | 15 | 314 | -0.248799 | NaN | NaN | NaN |
| 2026-01-19 12:40:00+08:00 | 105 | 760 | Ws_E14 | 0.138135 | 30 | 760.0 | 760.333333 | 760.6 | 761.666667 | 14526.0 | 14626.0 | 36 | 0.0 | -0.017889 | -0.004722 | 0.393902 | 0.555556 | 20.0 | True | 20.0 | 64.0 | 20.0 | 0.0 | 0 | 0.0 | 15 | 314 | -0.255550 | NaN | NaN | NaN |