| 2026-01-09 11:17:08+08:00 |
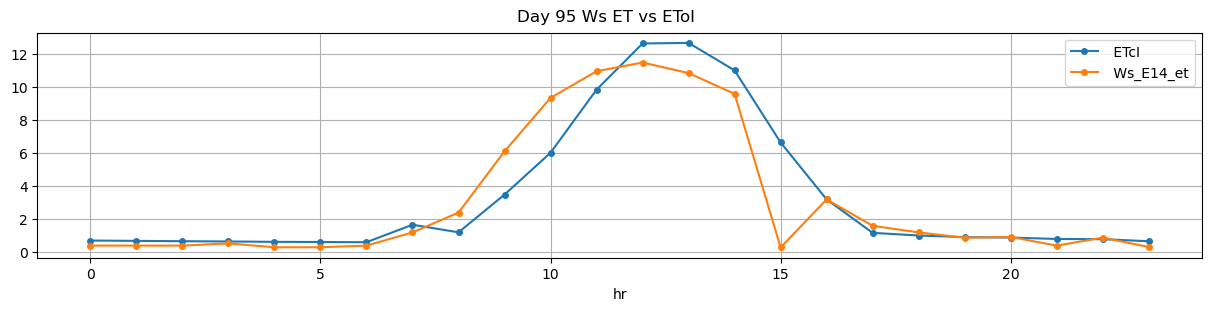
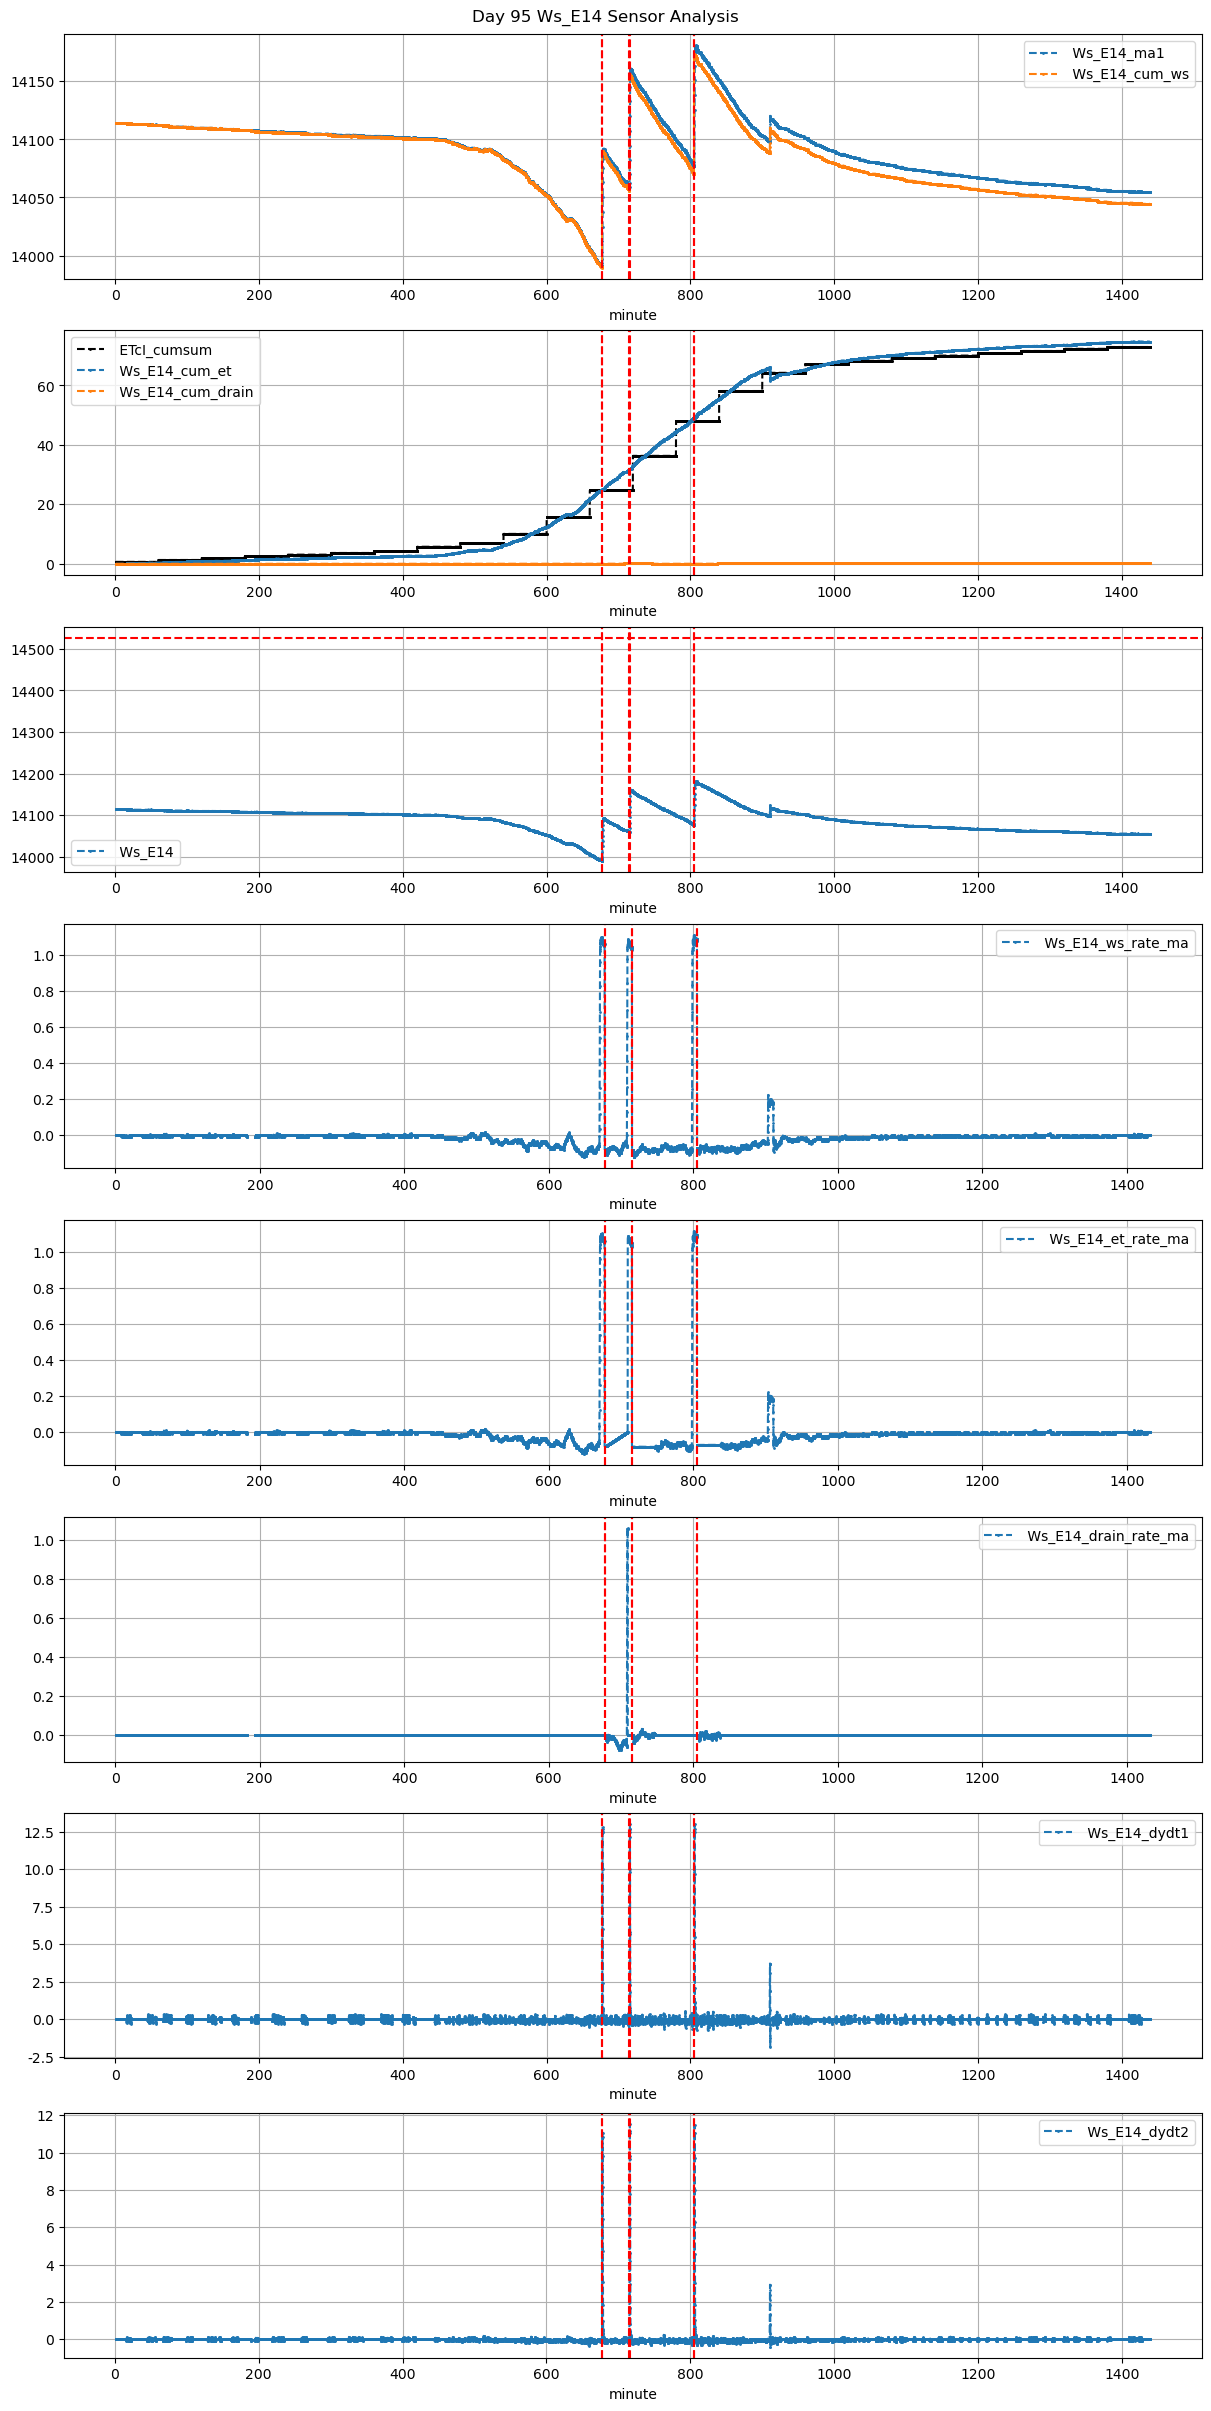
95 |
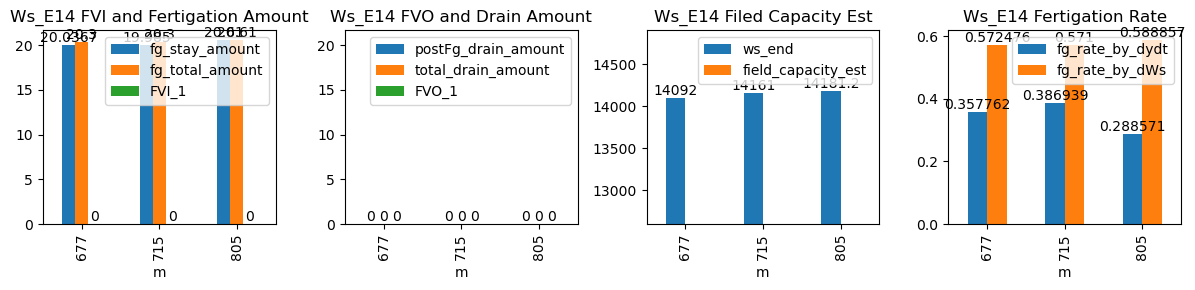
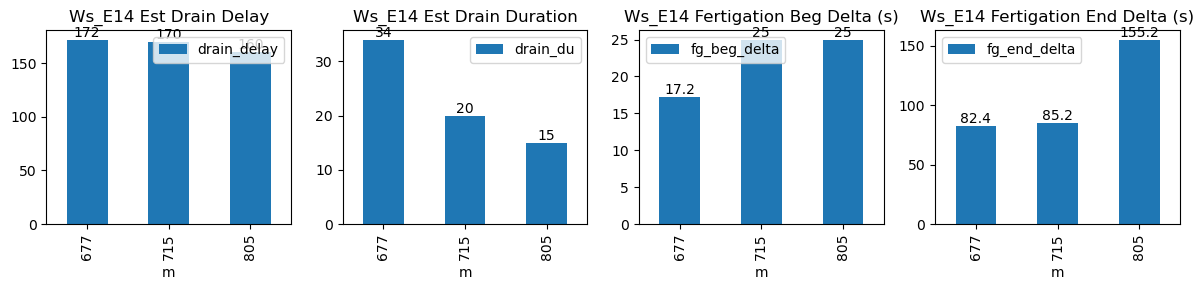
677 |
Ws_E14 |
0.237192 |
30 |
677.13 |
677.416667 |
677.71 |
679.083333 |
13991.233333 |
14092.0 |
35 |
-0.060602 |
-0.096493 |
-0.039205 |
0.365595 |
0.575810 |
20.153333 |
True |
17.2 |
82.4 |
20.195 |
0.0 |
0 |
0.0 |
34 |
172 |
-0.241626 |
NaN |
NaN |
NaN |
| 2026-01-09 11:55:00+08:00 |
95 |
715 |
Ws_E14 |
0.237192 |
30 |
715.00 |
715.416667 |
715.58 |
717.000000 |
14060.690909 |
14161.0 |
35 |
-0.042272 |
-0.110250 |
-0.081909 |
0.388265 |
0.573195 |
20.061818 |
True |
25.0 |
85.2 |
20.195 |
0.0 |
0 |
0.0 |
20 |
170 |
-0.295708 |
NaN |
NaN |
NaN |
| 2026-01-09 13:25:00+08:00 |
95 |
805 |
Ws_E14 |
0.237192 |
30 |
805.00 |
805.416667 |
805.58 |
808.166667 |
14077.800000 |
14182.0 |
35 |
-0.083333 |
-0.066389 |
-0.070417 |
0.276429 |
0.595429 |
20.840000 |
True |
25.0 |
155.2 |
20.840 |
0.0 |
0 |
0.0 |
15 |
160 |
-0.424458 |
NaN |
NaN |
NaN |