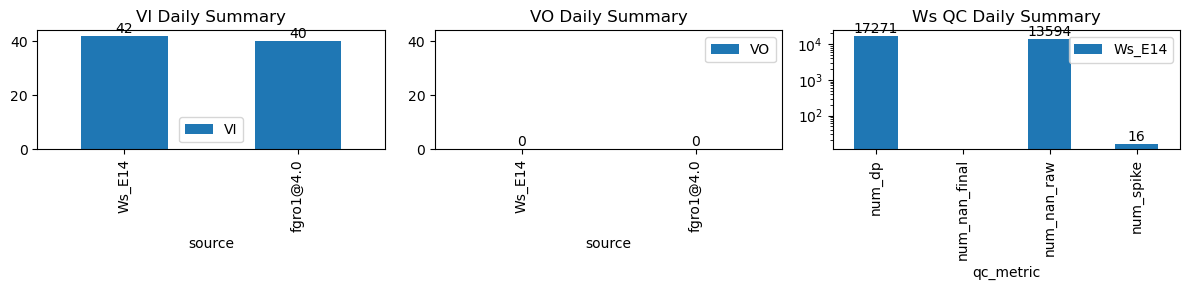
VI and VO Daily Summary
| ws_name | num_dp | num_nan_raw | num_nan_final | num_spike | cum_step_adj |
|---|---|---|---|---|---|
| Ws_E14 | 17,271 | 13,594 | 0 | 16 | 0.00 |
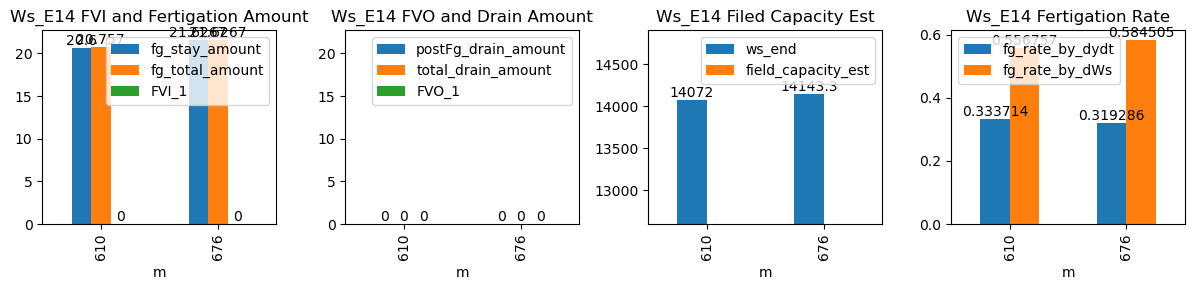
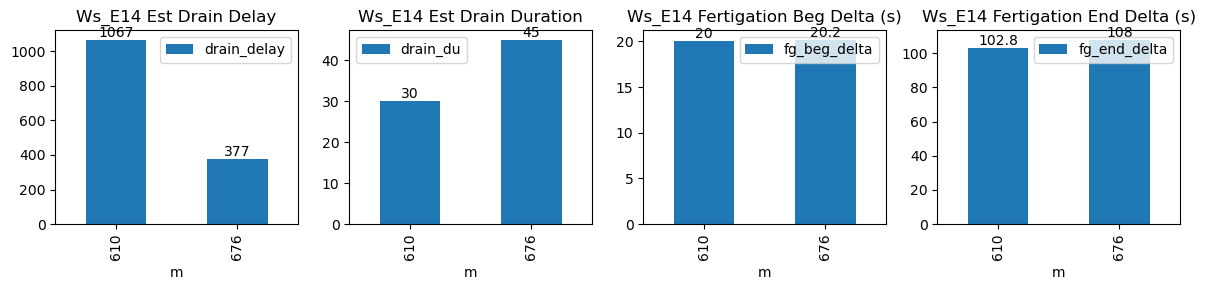
| ds | d | m | ws_name | prominence_cut | max_drain_du | fg_beg | fg_beg_est | fg_end | fg_end_est | ws_beg | ws_end | duc | pre_fg_et | post_fg_ws | post_drn_et | fg_rate_by_dydt | fg_rate_by_dWs | fg_stay_amount | enough_data | fg_beg_delta | fg_end_delta | fg_total_amount | fg_drain_amount | postFg_drain_amount | total_drain_amount | drain_du | drain_delay | drain_rate | field_capacity_est | FVI_1 | FVO_1 |
|---|---|---|---|---|---|---|---|---|---|---|---|---|---|---|---|---|---|---|---|---|---|---|---|---|---|---|---|---|---|---|---|
| 2025-12-30 10:10:00+08:00 | 85 | 610 | Ws_E14 | 0.436424 | 30 | 610.00 | 610.333333 | 610.62 | 612.333333 | 13969.0 | 14072.000000 | 37 | -0.029526 | -0.039383 | -0.077325 | 0.333714 | 0.556757 | 20.600000 | True | 20.0 | 102.8 | 20.757000 | 0.0 | 0 | 0.0 | 30 | 1067 | -0.073171 | NaN | NaN | NaN |
| 2025-12-30 11:16:05+08:00 | 85 | 676 | Ws_E14 | 0.436424 | 30 | 676.08 | 676.416667 | 676.70 | 678.500000 | 14035.2 | 14143.333333 | 37 | -0.057346 | -0.034012 | -0.048025 | 0.319286 | 0.584505 | 21.626667 | True | 20.2 | 108.0 | 21.626667 | 0.0 | 0 | 0.0 | 45 | 377 | -0.086556 | NaN | NaN | NaN |