| 2025-12-29 10:10:00+08:00 |
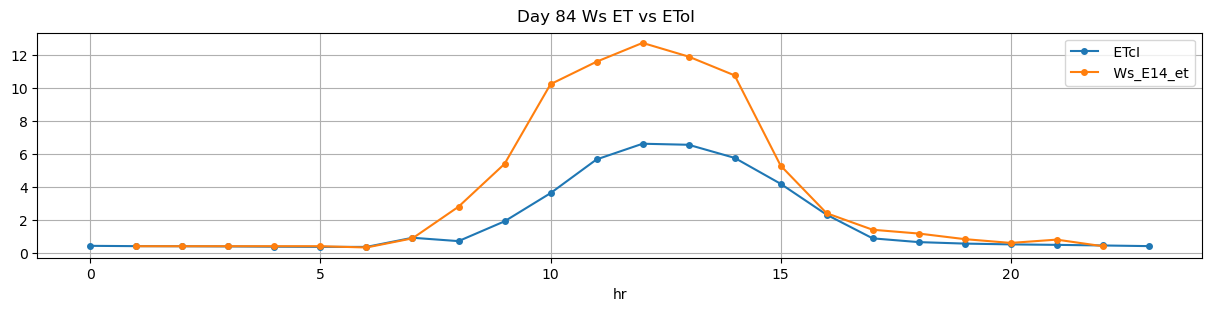
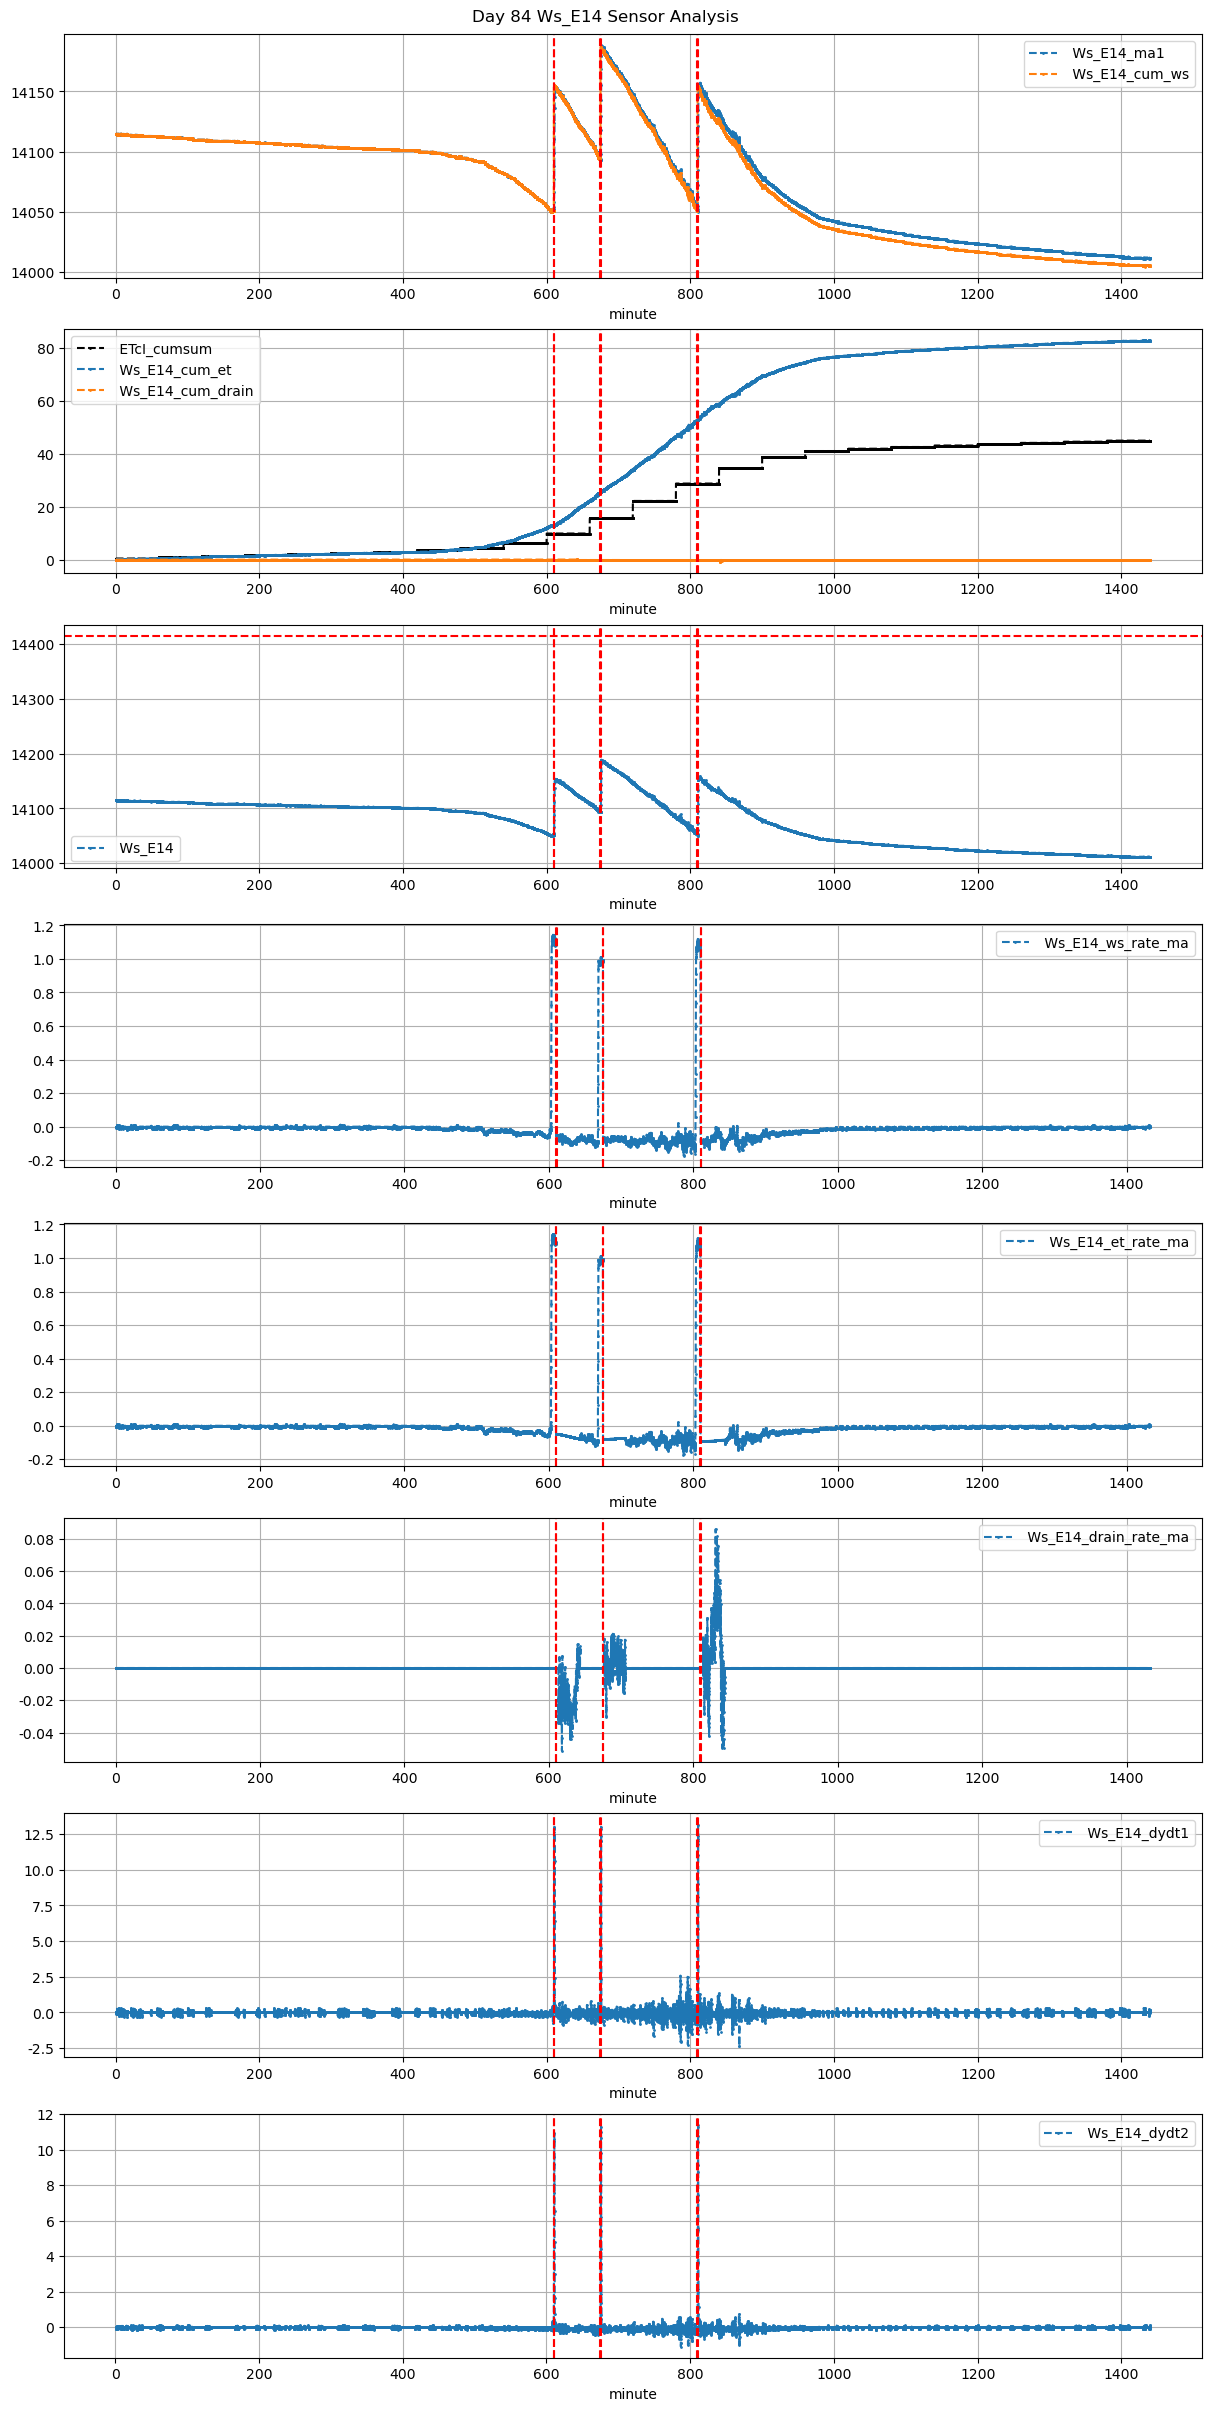
84 |
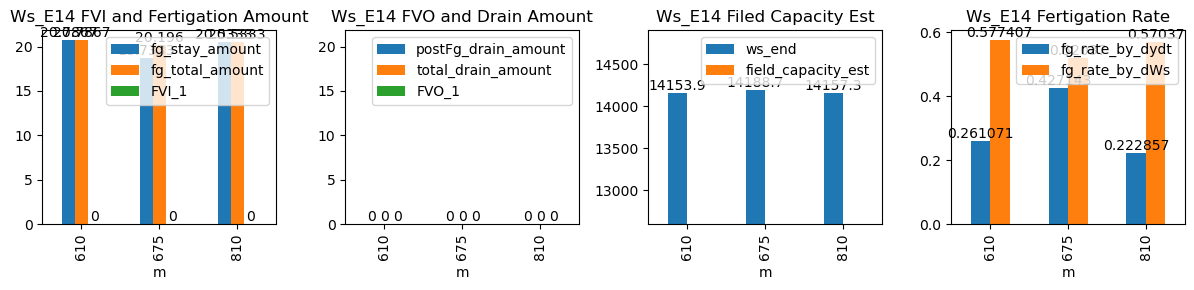
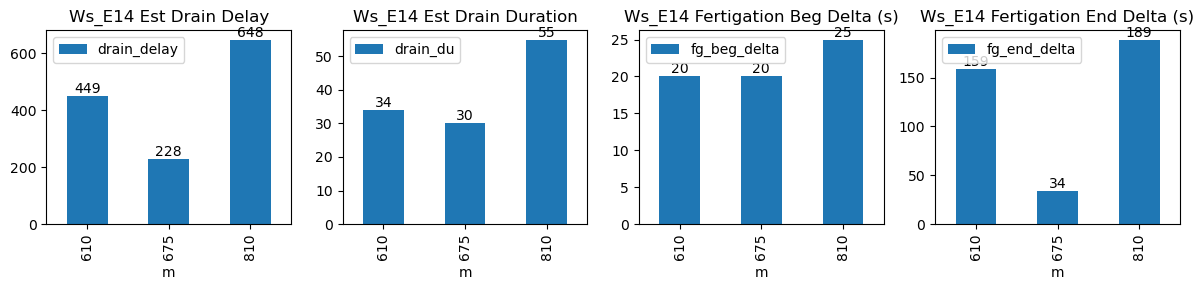
610 |
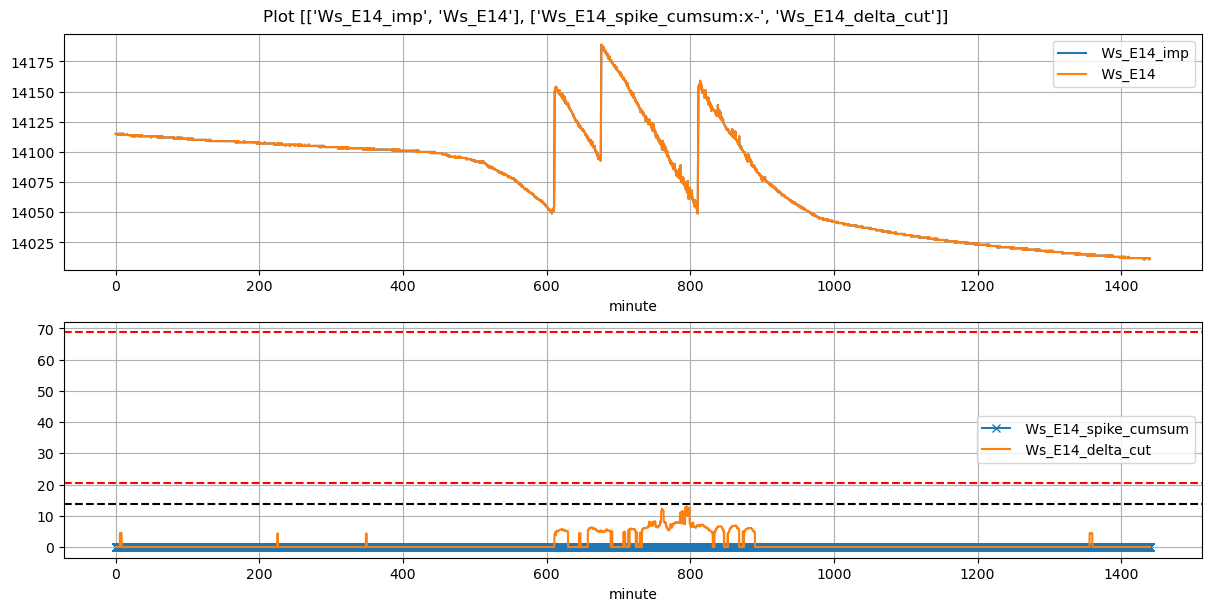
Ws_E14 |
0.347798 |
30 |
610.0 |
610.333333 |
610.6 |
613.250000 |
14050.000000 |
14153.933333 |
36 |
-0.048247 |
-0.072037 |
-0.078144 |
0.261071 |
0.577407 |
20.786667 |
True |
20.0 |
159.0 |
20.786667 |
0.0 |
0 |
0.0 |
34 |
449 |
-0.035555 |
NaN |
NaN |
NaN |
| 2025-12-29 11:15:00+08:00 |
84 |
675 |
Ws_E14 |
0.347798 |
30 |
675.0 |
675.333333 |
675.6 |
676.166667 |
14095.000000 |
14188.666667 |
36 |
-0.098543 |
-0.079463 |
-0.072974 |
0.427143 |
0.520370 |
18.733333 |
True |
20.0 |
34.0 |
20.196000 |
0.0 |
0 |
0.0 |
30 |
228 |
-0.015447 |
NaN |
NaN |
NaN |
| 2025-12-29 13:30:00+08:00 |
84 |
810 |
Ws_E14 |
0.347798 |
30 |
810.0 |
810.416667 |
810.6 |
813.750000 |
14054.666667 |
14157.333333 |
36 |
-0.098627 |
-0.093951 |
-0.083148 |
0.222857 |
0.570370 |
20.533333 |
True |
25.0 |
189.0 |
20.533333 |
0.0 |
0 |
0.0 |
55 |
648 |
-0.035681 |
NaN |
NaN |
NaN |