| 2025-12-28 10:00:00+08:00 |
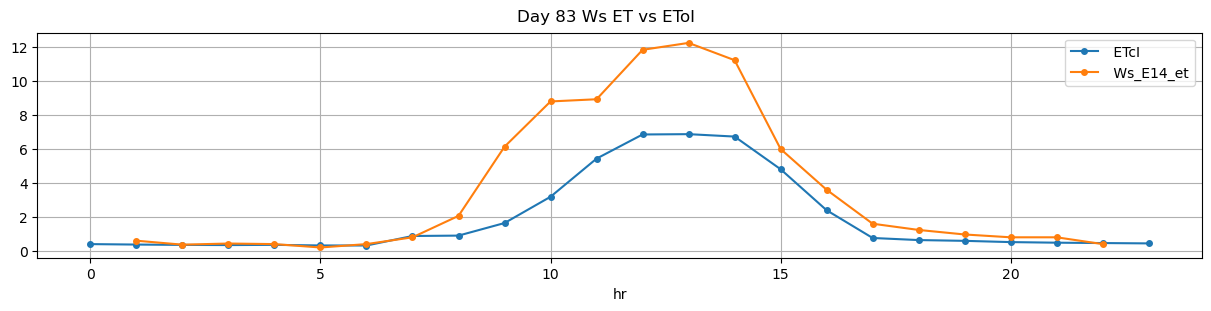
83 |
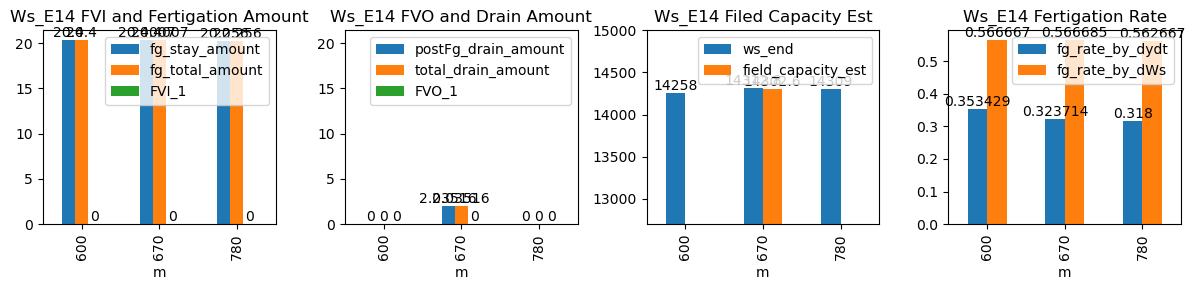
600 |
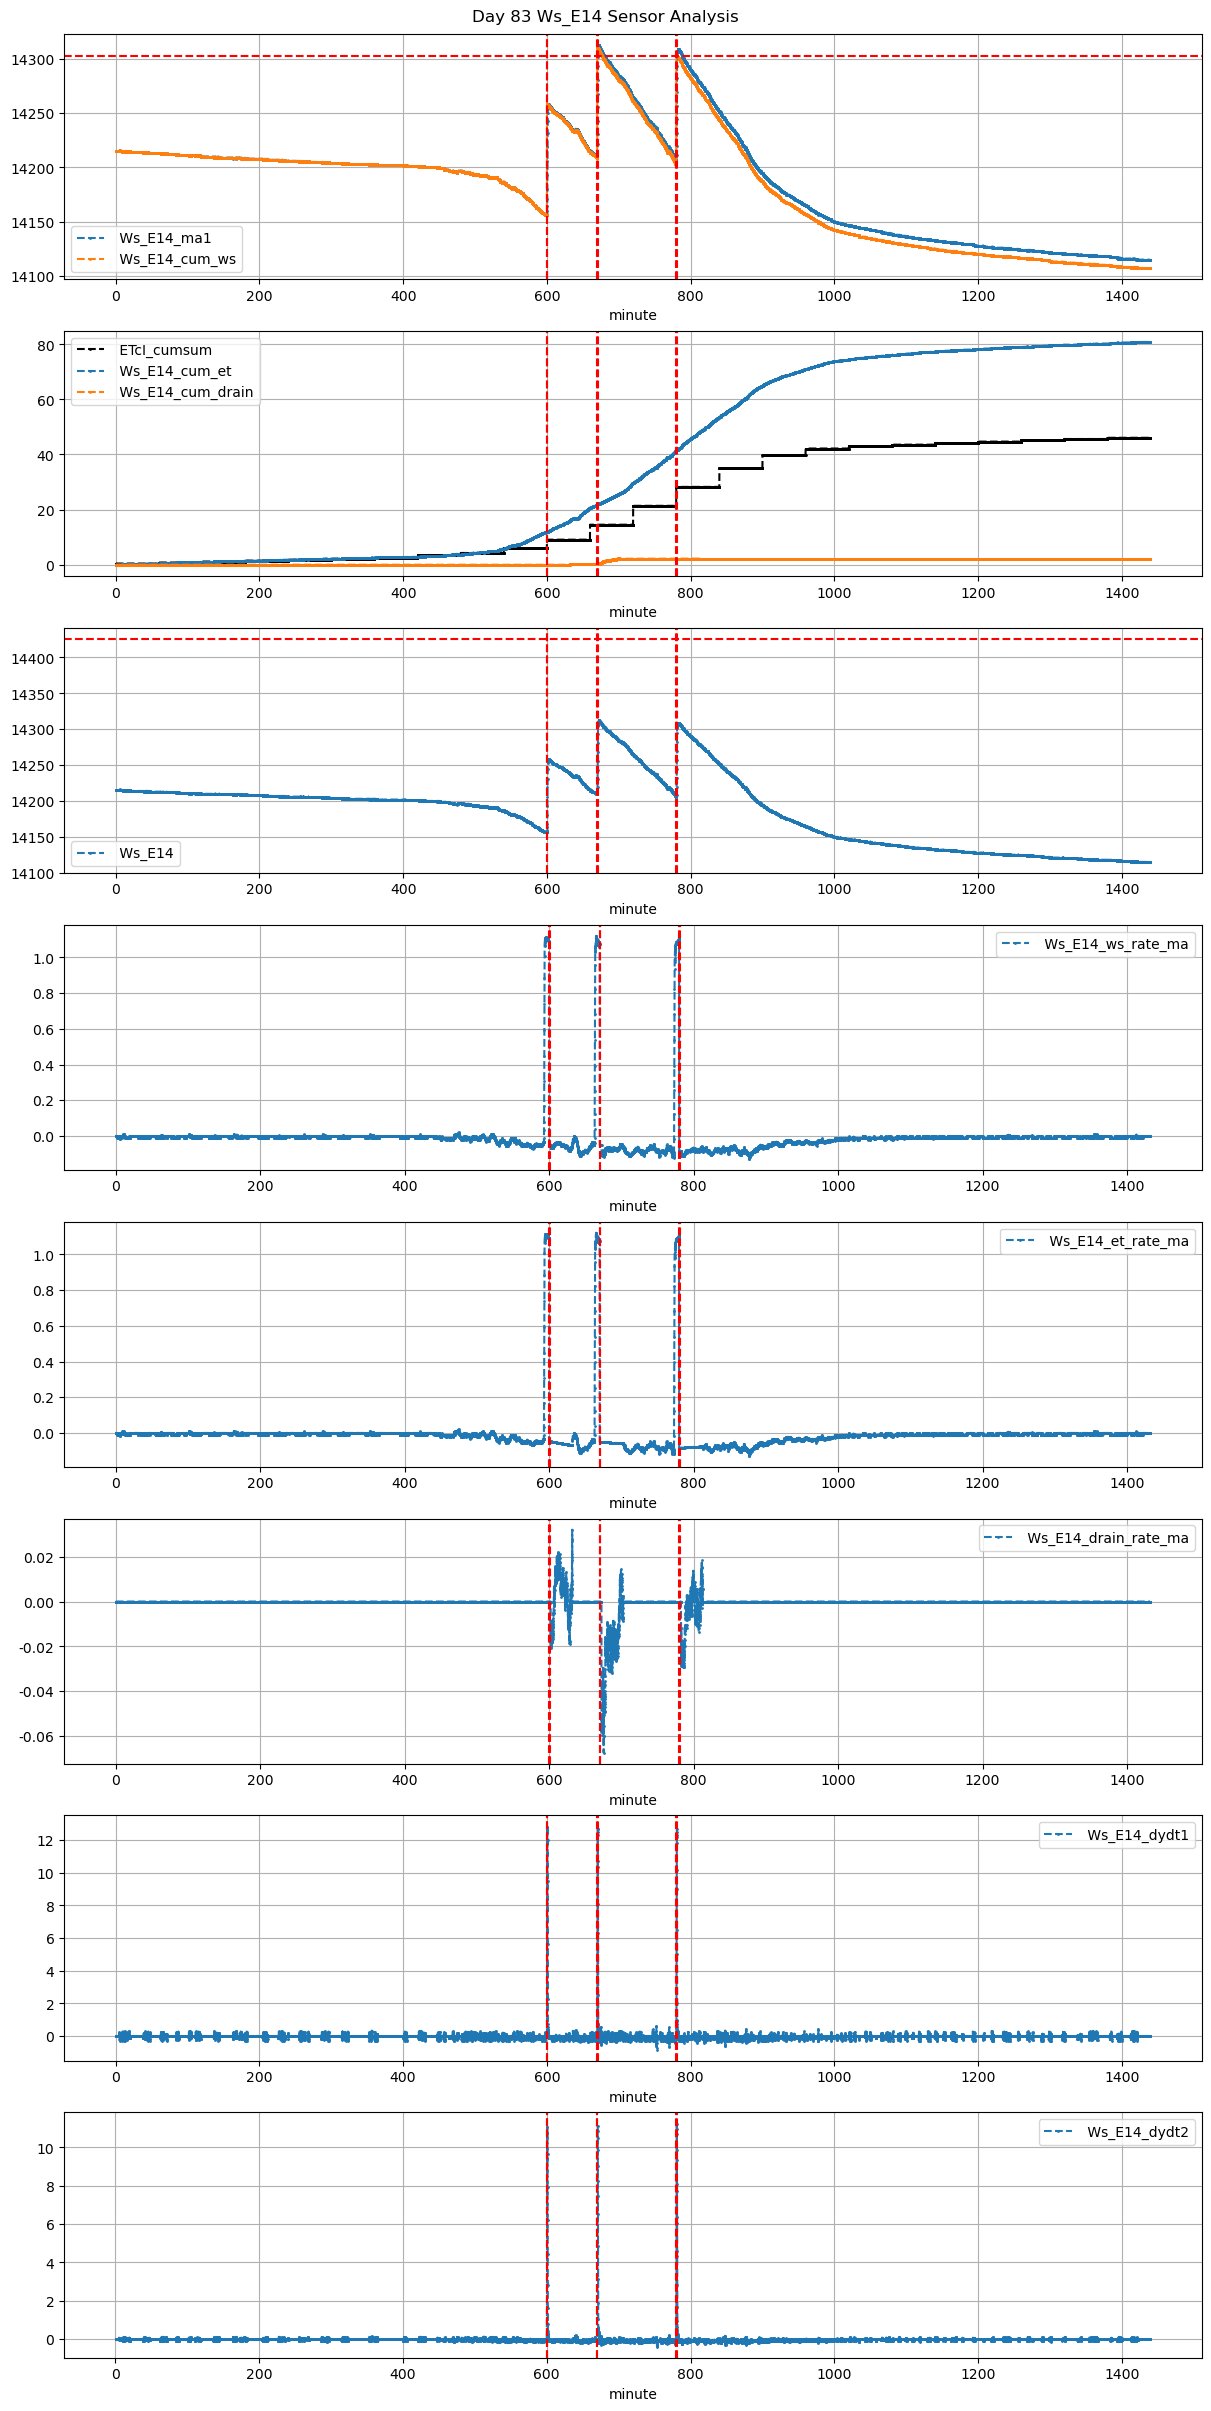
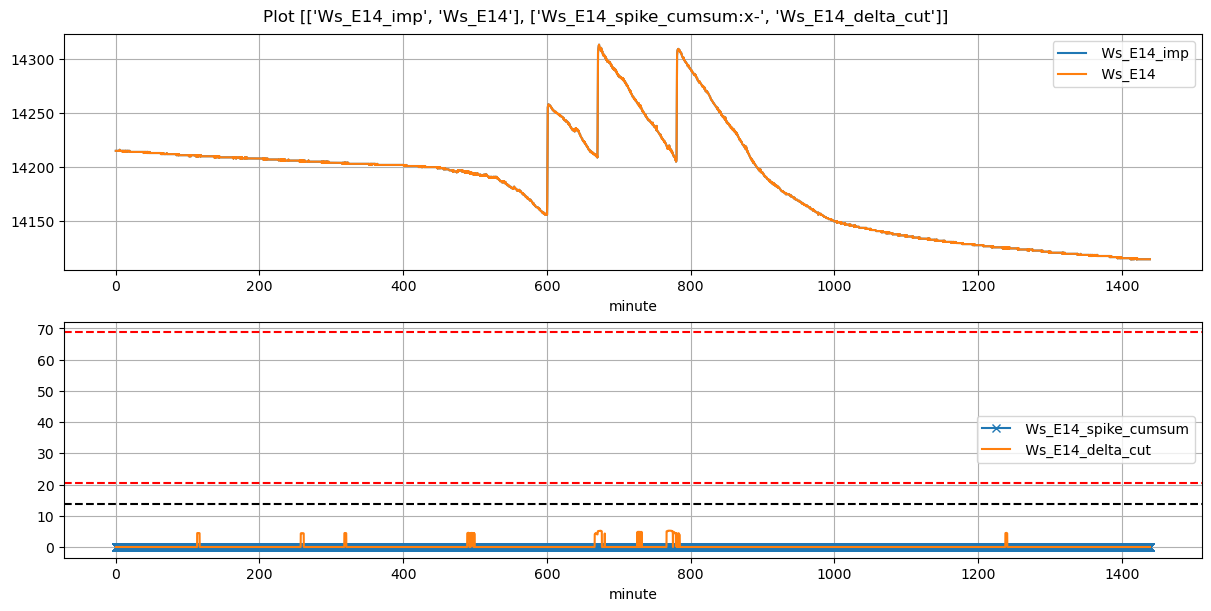
Ws_E14 |
0.233209 |
30 |
600.0 |
600.333333 |
600.6 |
602.166667 |
14156.000000 |
14258.00 |
36 |
-0.047758 |
-0.055370 |
-0.068778 |
0.353429 |
0.566667 |
20.400000 |
True |
20.0 |
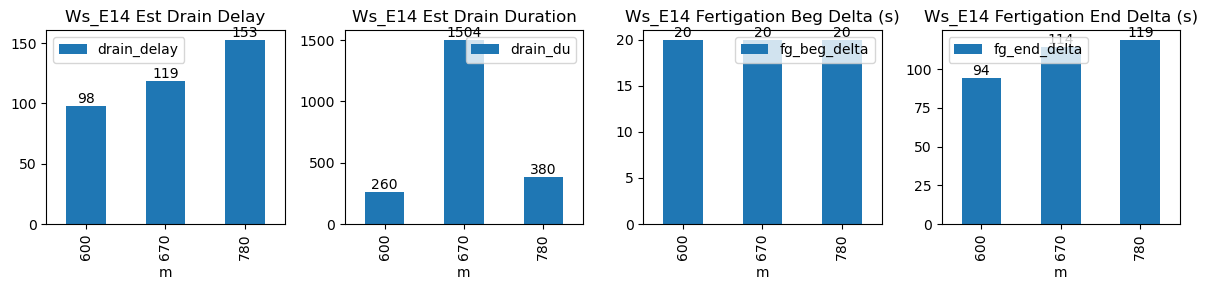
94.0 |
20.400000 |
0.0 |
0.000000 |
0.000000 |
260 |
98 |
-0.018664 |
NaN |
NaN |
NaN |
| 2025-12-28 11:10:00+08:00 |
83 |
670 |
Ws_E14 |
0.233209 |
30 |
670.0 |
670.333333 |
670.6 |
672.500000 |
14210.746667 |
14312.75 |
36 |
-0.050396 |
-0.090607 |
-0.058222 |
0.323714 |
0.566685 |
20.400667 |
True |
20.0 |
114.0 |
20.400667 |
0.0 |
2.035156 |
2.035156 |
1504 |
119 |
-0.051136 |
14302.574219 |
NaN |
NaN |
| 2025-12-28 13:00:00+08:00 |
83 |
780 |
Ws_E14 |
0.233209 |
30 |
780.0 |
780.333333 |
780.6 |
782.583333 |
14207.720000 |
14309.00 |
36 |
-0.082751 |
-0.098969 |
-0.074938 |
0.318000 |
0.562667 |
20.256000 |
True |
20.0 |
119.0 |
20.256000 |
0.0 |
0.000000 |
0.000000 |
380 |
153 |
-0.026384 |
NaN |
NaN |
NaN |