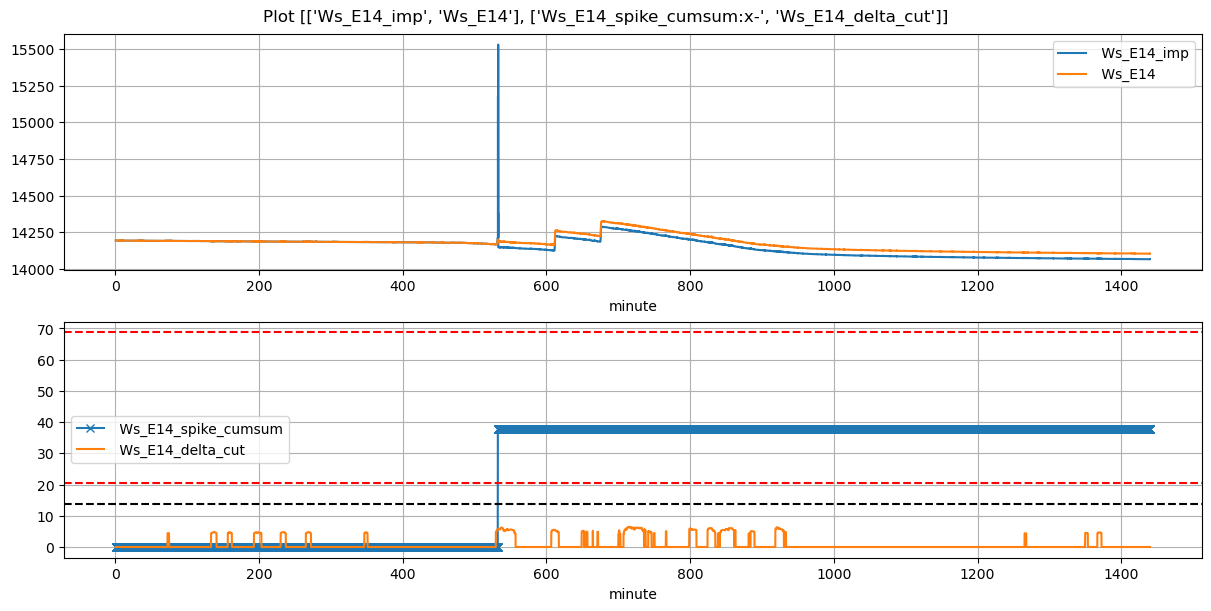
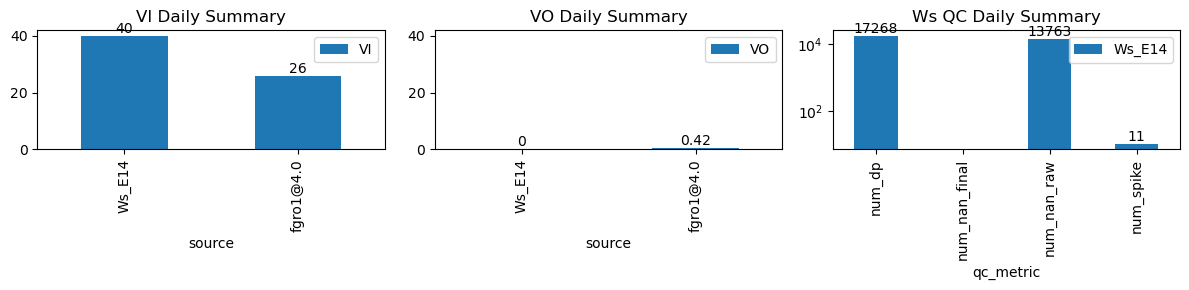
VI and VO Daily Summary
| ws_name | num_dp | num_nan_raw | num_nan_final | num_spike | cum_step_adj |
|---|---|---|---|---|---|
| Ws_E14 | 17,268 | 13,763 | 0 | 11 | 37.79 |
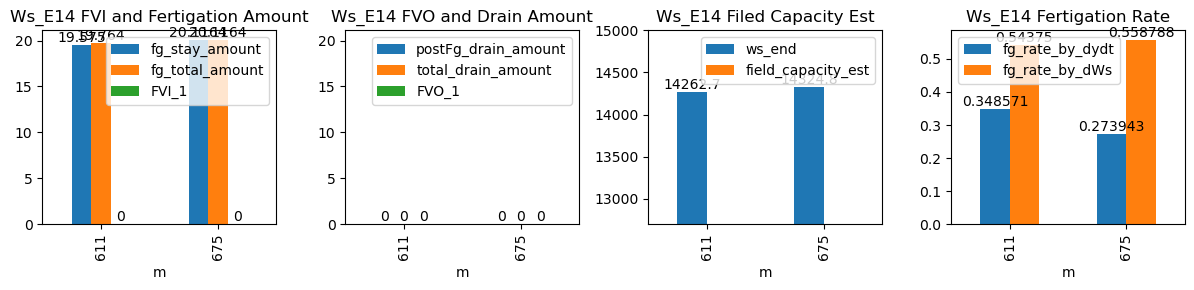
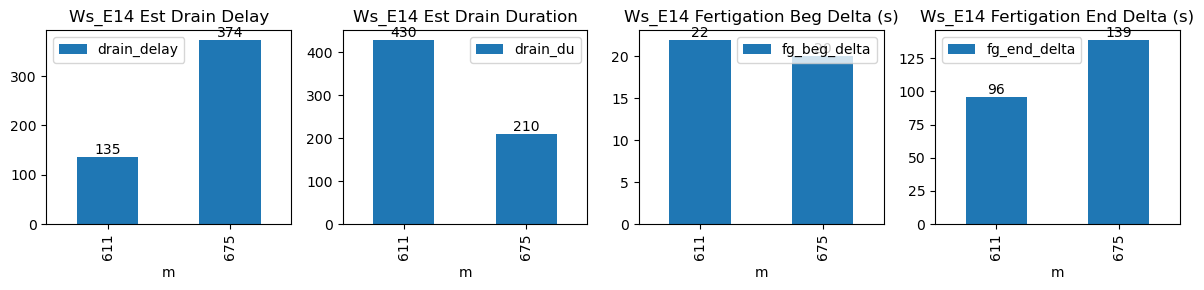
| ds | d | m | ws_name | prominence_cut | max_drain_du | fg_beg | fg_beg_est | fg_end | fg_end_est | ws_beg | ws_end | duc | pre_fg_et | post_fg_ws | post_drn_et | fg_rate_by_dydt | fg_rate_by_dWs | fg_stay_amount | enough_data | fg_beg_delta | fg_end_delta | fg_total_amount | fg_drain_amount | postFg_drain_amount | total_drain_amount | drain_du | drain_delay | drain_rate | field_capacity_est | FVI_1 | FVO_1 |
|---|---|---|---|---|---|---|---|---|---|---|---|---|---|---|---|---|---|---|---|---|---|---|---|---|---|---|---|---|---|---|---|
| 2025-12-18 10:11:03+08:00 | 73 | 611 | Ws_E14 | 0.250064 | 30 | 611.05 | 611.416667 | 611.65 | 613.250000 | 14164.785714 | 14262.660714 | 36 | -0.028465 | -0.064568 | -0.045463 | 0.348571 | 0.543750 | 19.575000 | True | 22.0 | 96.0 | 19.764000 | 0.0 | 0.0 | 0.0 | 430 | 135 | -0.059892 | NaN | NaN | NaN |
| 2025-12-18 11:15:00+08:00 | 73 | 675 | Ws_E14 | 0.250064 | 30 | 675.00 | 675.333333 | 675.60 | 677.916667 | 14224.203896 | 14324.785714 | 36 | -0.055743 | -0.066173 | -0.061650 | 0.273943 | 0.558788 | 20.116364 | True | 20.0 | 139.0 | 20.116364 | 0.0 | 0.0 | 0.0 | 210 | 374 | -0.020090 | NaN | NaN | NaN |