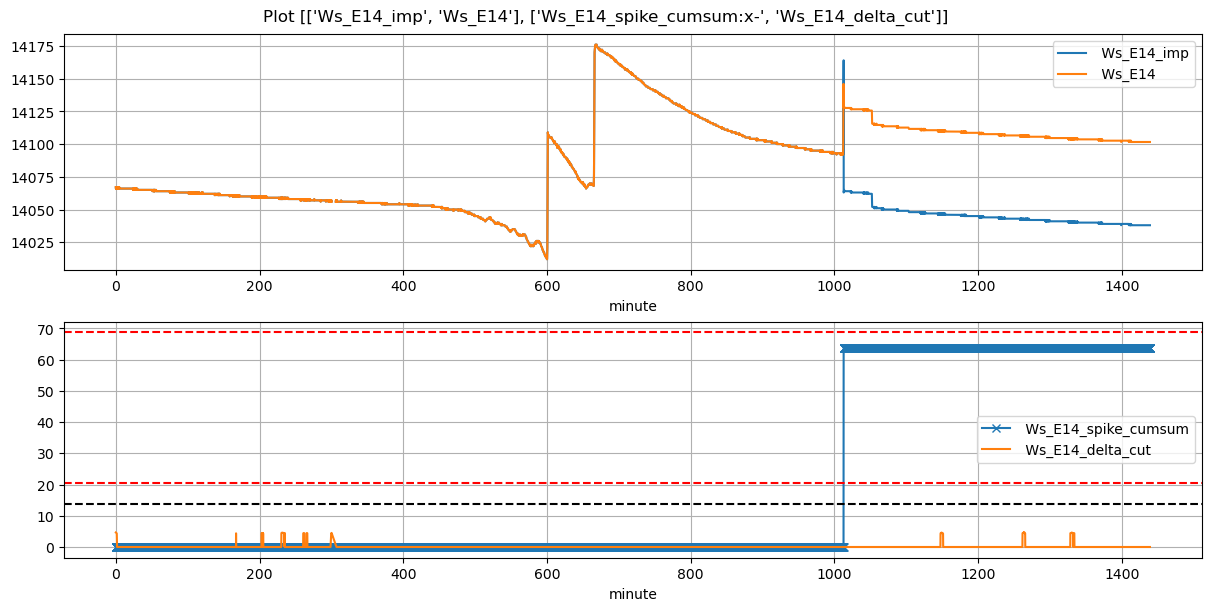
VI and VO Daily Summary
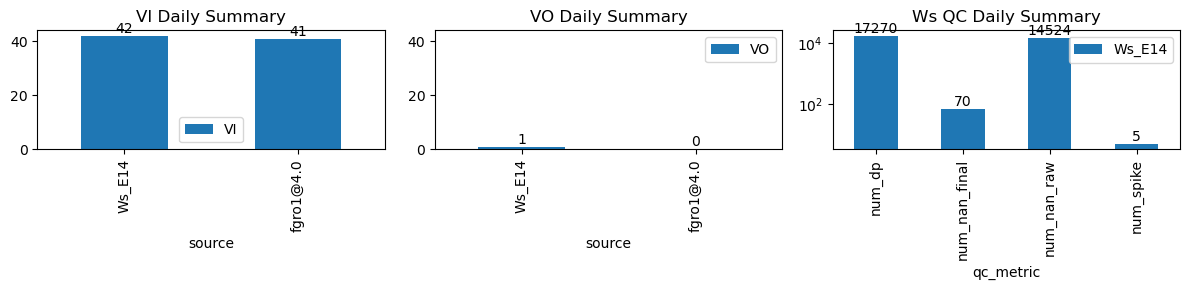
| ws_name | num_dp | num_nan_raw | num_nan_final | num_spike | cum_step_adj |
|---|---|---|---|---|---|
| Ws_E14 | 17,270 | 14,524 | 70 | 5 | 63.60 |
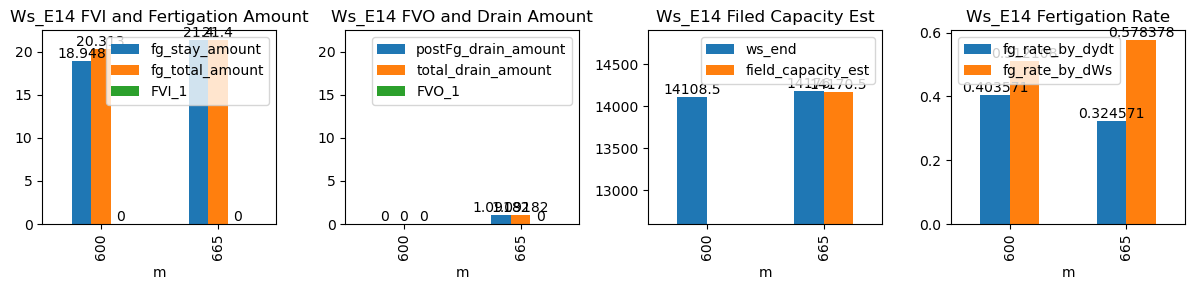
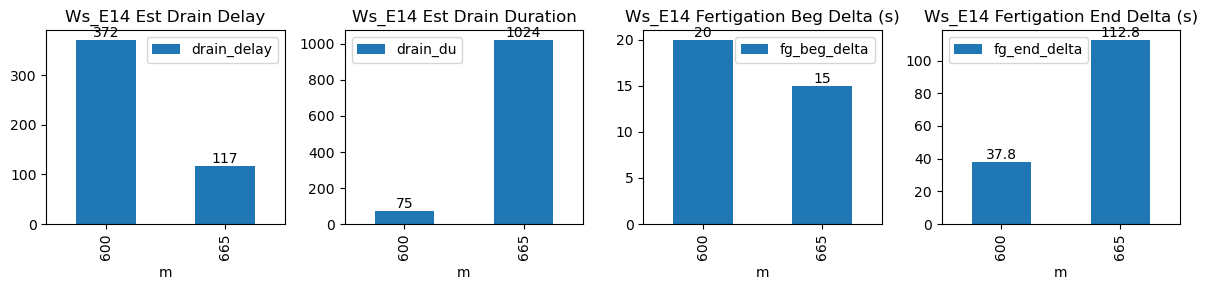
| ds | d | m | ws_name | prominence_cut | max_drain_du | fg_beg | fg_beg_est | fg_end | fg_end_est | ws_beg | ws_end | duc | pre_fg_et | post_fg_ws | post_drn_et | fg_rate_by_dydt | fg_rate_by_dWs | fg_stay_amount | enough_data | fg_beg_delta | fg_end_delta | fg_total_amount | fg_drain_amount | postFg_drain_amount | total_drain_amount | drain_du | drain_delay | drain_rate | field_capacity_est | FVI_1 | FVO_1 |
|---|---|---|---|---|---|---|---|---|---|---|---|---|---|---|---|---|---|---|---|---|---|---|---|---|---|---|---|---|---|---|---|
| 2025-12-19 10:00:00+08:00 | 74 | 600 | Ws_E14 | 0.227938 | 30 | 600.0 | 600.333333 | 600.62 | 601.25 | 14013.76 | 14108.5 | 37 | -0.093147 | -0.057392 | -0.065833 | 0.403571 | 0.512108 | 18.948 | True | 20.0 | 37.8 | 20.313 | 0.0 | 0.000000 | 0.000000 | 75 | 372 | -0.014617 | NaN | NaN | NaN |
| 2025-12-19 11:05:00+08:00 | 74 | 665 | Ws_E14 | 0.227938 | 30 | 665.0 | 665.250000 | 665.62 | 667.50 | 14069.00 | 14176.0 | 37 | 0.000000 | -0.035864 | -0.042783 | 0.324571 | 0.578378 | 21.400 | True | 15.0 | 112.8 | 21.400 | 0.0 | 1.091819 | 1.091819 | 1024 | 117 | -0.047813 | 14170.540904 | NaN | NaN |