| 2025-12-09 08:00:00+08:00 |
64 |
480 |
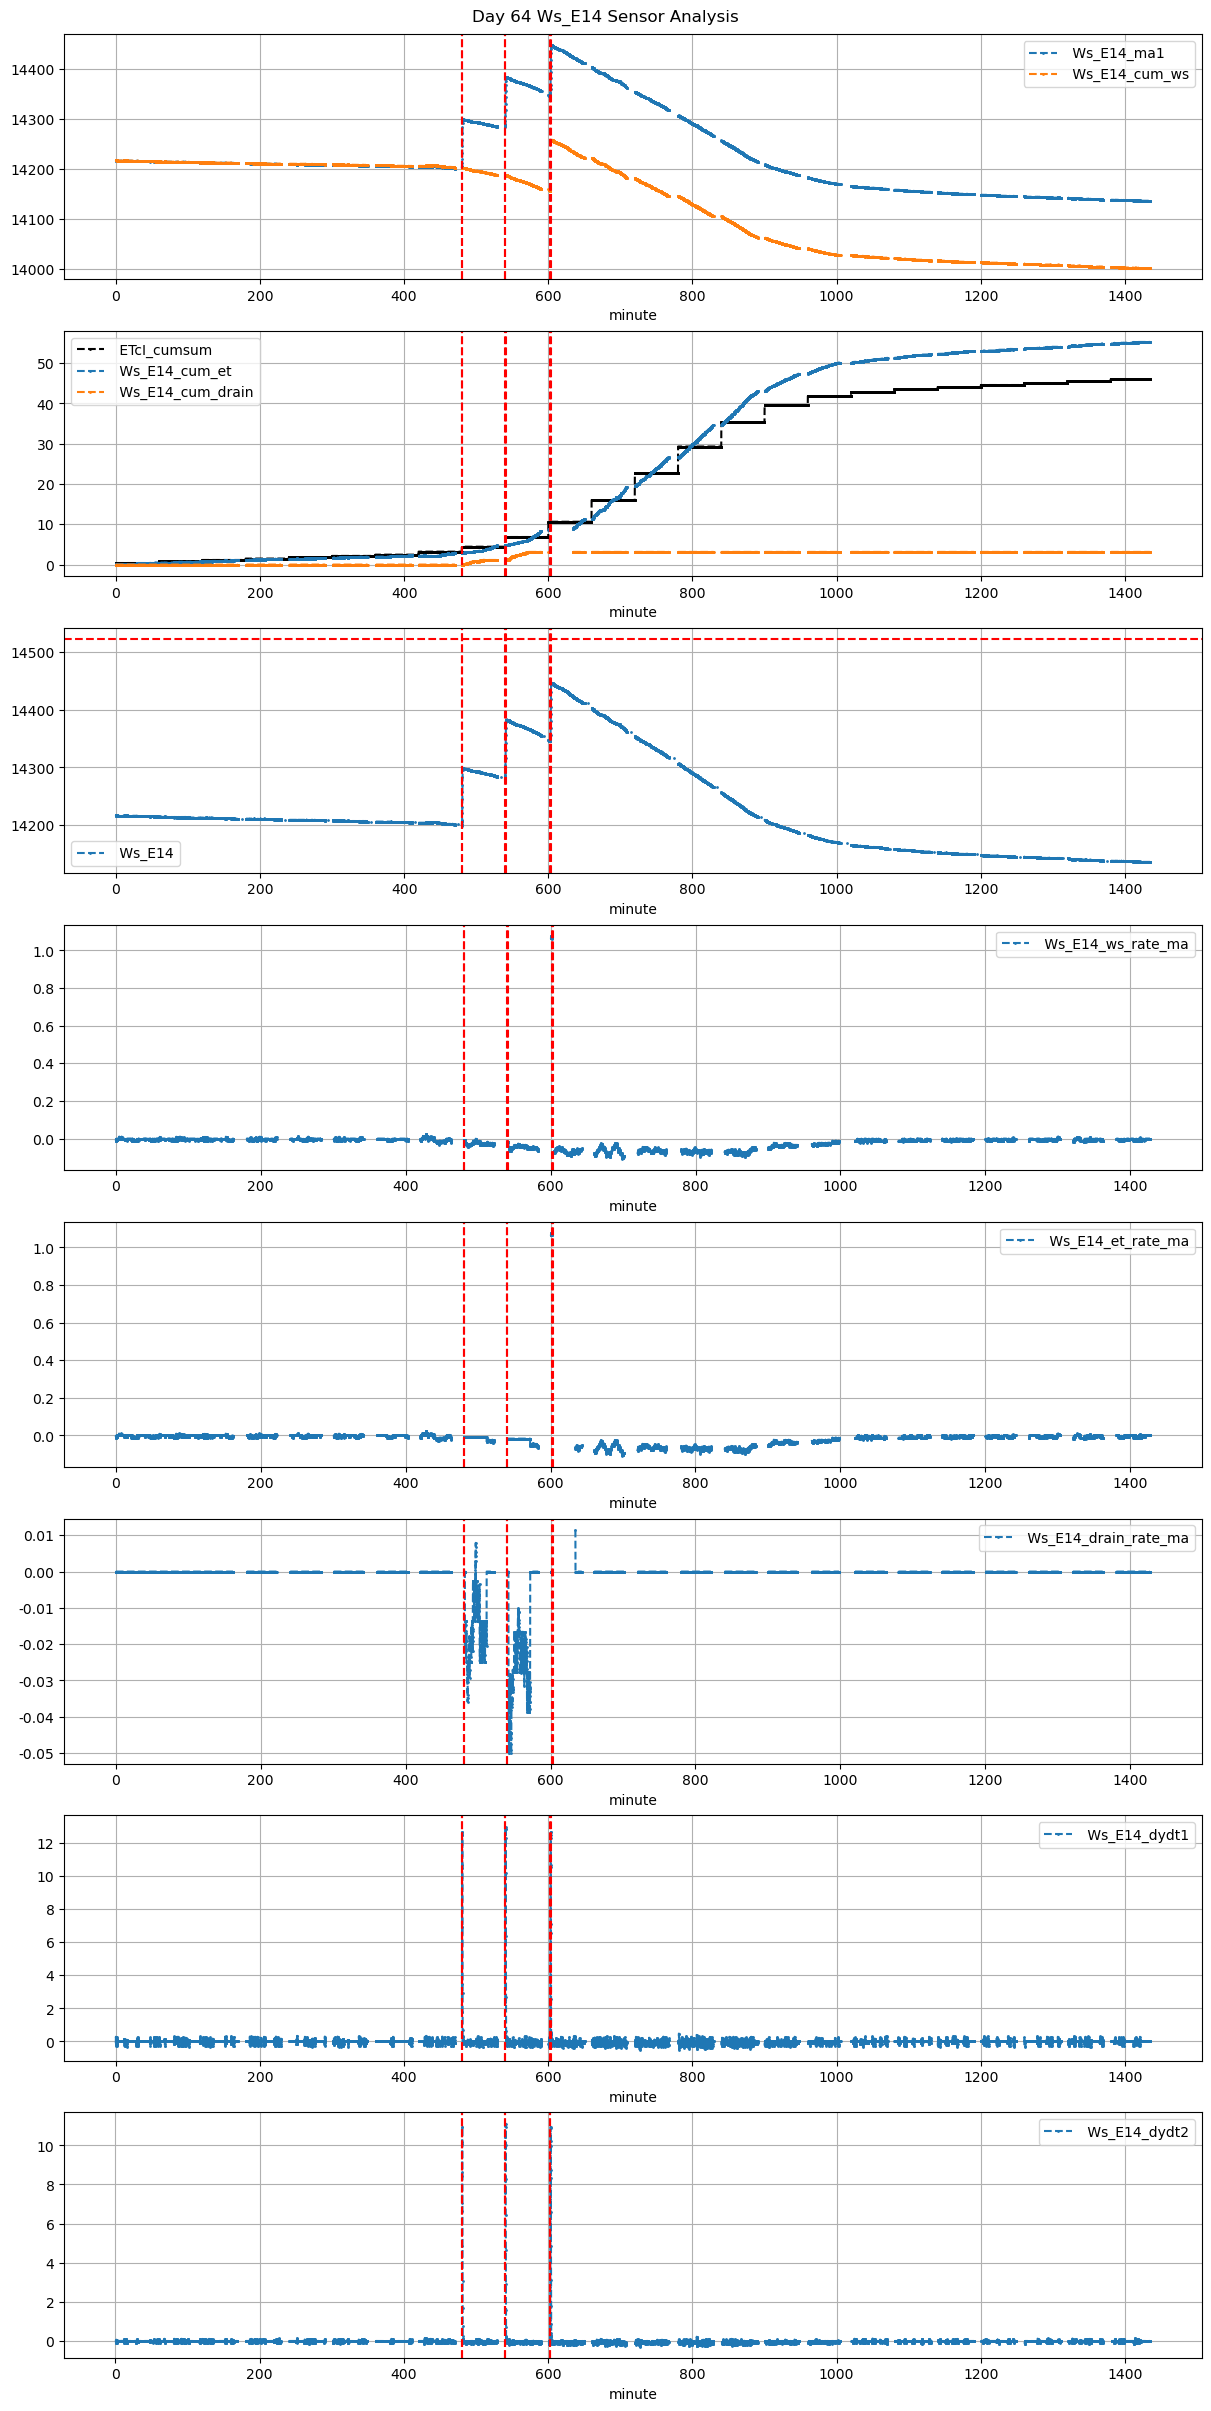
Ws_E14 |
0.230186 |
30 |
480.0 |
NaN |
480.62 |
481.833333 |
14201.000000 |
14298.833333 |
37 |
-0.008531 |
-0.031358 |
-0.008531 |
NaN |
0.528829 |
19.566667 |
False |
NaN |
72.8 |
NaN |
0.0 |
0.0 |
0.0 |
NaN |
NaN |
NaN |
NaN |
NaN |
NaN |
| 2025-12-09 09:00:00+08:00 |
64 |
540 |
Ws_E14 |
0.230186 |
30 |
540.0 |
NaN |
540.62 |
541.916667 |
14284.000000 |
14383.000000 |
37 |
-0.016718 |
-0.052160 |
-0.016718 |
NaN |
0.535135 |
19.800000 |
False |
NaN |
77.8 |
NaN |
0.0 |
0.0 |
0.0 |
NaN |
NaN |
NaN |
NaN |
NaN |
NaN |
| 2025-12-09 10:02:36+08:00 |
64 |
602 |
Ws_E14 |
0.230186 |
30 |
602.6 |
602.916667 |
603.22 |
604.416667 |
14345.444444 |
14447.000000 |
37 |
NaN |
-0.058133 |
-0.074429 |
0.369714 |
0.548949 |
20.311111 |
True |
19.0 |
71.8 |
20.311111 |
0.0 |
0.0 |
0.0 |
NaN |
NaN |
NaN |
NaN |
NaN |
NaN |