| 2025-12-08 07:45:00+08:00 |
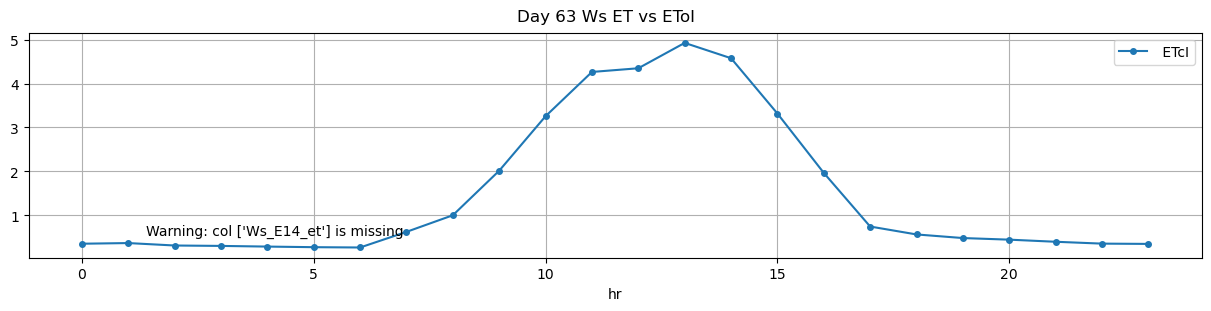
63 |
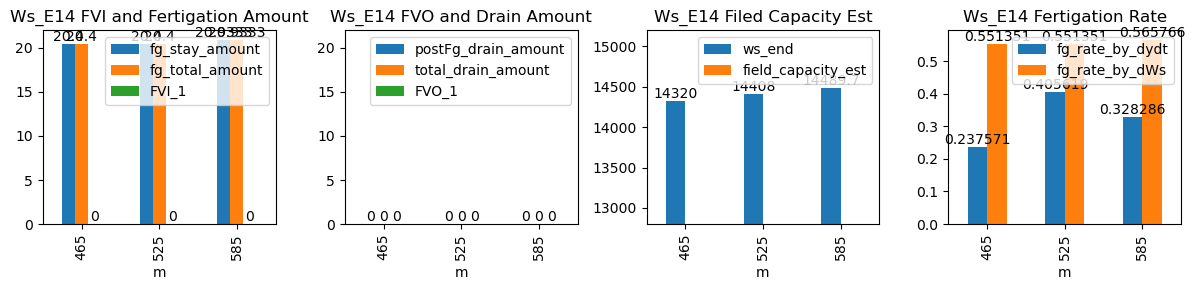
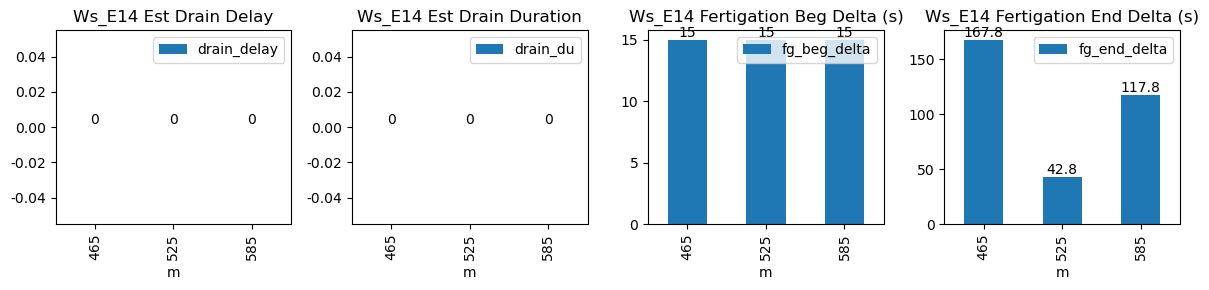
465 |
Ws_E14 |
0.402129 |
30 |
465.0 |
465.25 |
465.62 |
468.416667 |
14218.0 |
14320.000000 |
37 |
-0.001684 |
NaN |
-0.018988 |
0.237571 |
0.551351 |
20.400000 |
True |
15.0 |
167.8 |
20.400000 |
0.0 |
0 |
0.0 |
NaN |
NaN |
NaN |
NaN |
NaN |
NaN |
| 2025-12-08 08:45:00+08:00 |
63 |
525 |
Ws_E14 |
0.402129 |
30 |
525.0 |
525.25 |
525.62 |
526.333333 |
14306.0 |
14408.000000 |
37 |
-0.021688 |
NaN |
-0.031852 |
0.405619 |
0.551351 |
20.400000 |
True |
15.0 |
42.8 |
20.400000 |
0.0 |
0 |
0.0 |
NaN |
NaN |
NaN |
NaN |
NaN |
NaN |
| 2025-12-08 09:45:00+08:00 |
63 |
585 |
Ws_E14 |
0.402129 |
30 |
585.0 |
585.25 |
585.62 |
587.583333 |
14385.0 |
14489.666667 |
37 |
-0.048231 |
NaN |
-0.046216 |
0.328286 |
0.565766 |
20.933333 |
True |
15.0 |
117.8 |
20.933333 |
0.0 |
0 |
0.0 |
NaN |
NaN |
NaN |
NaN |
NaN |
NaN |