| 2025-11-28 09:00:00+08:00 |
53 |
540 |
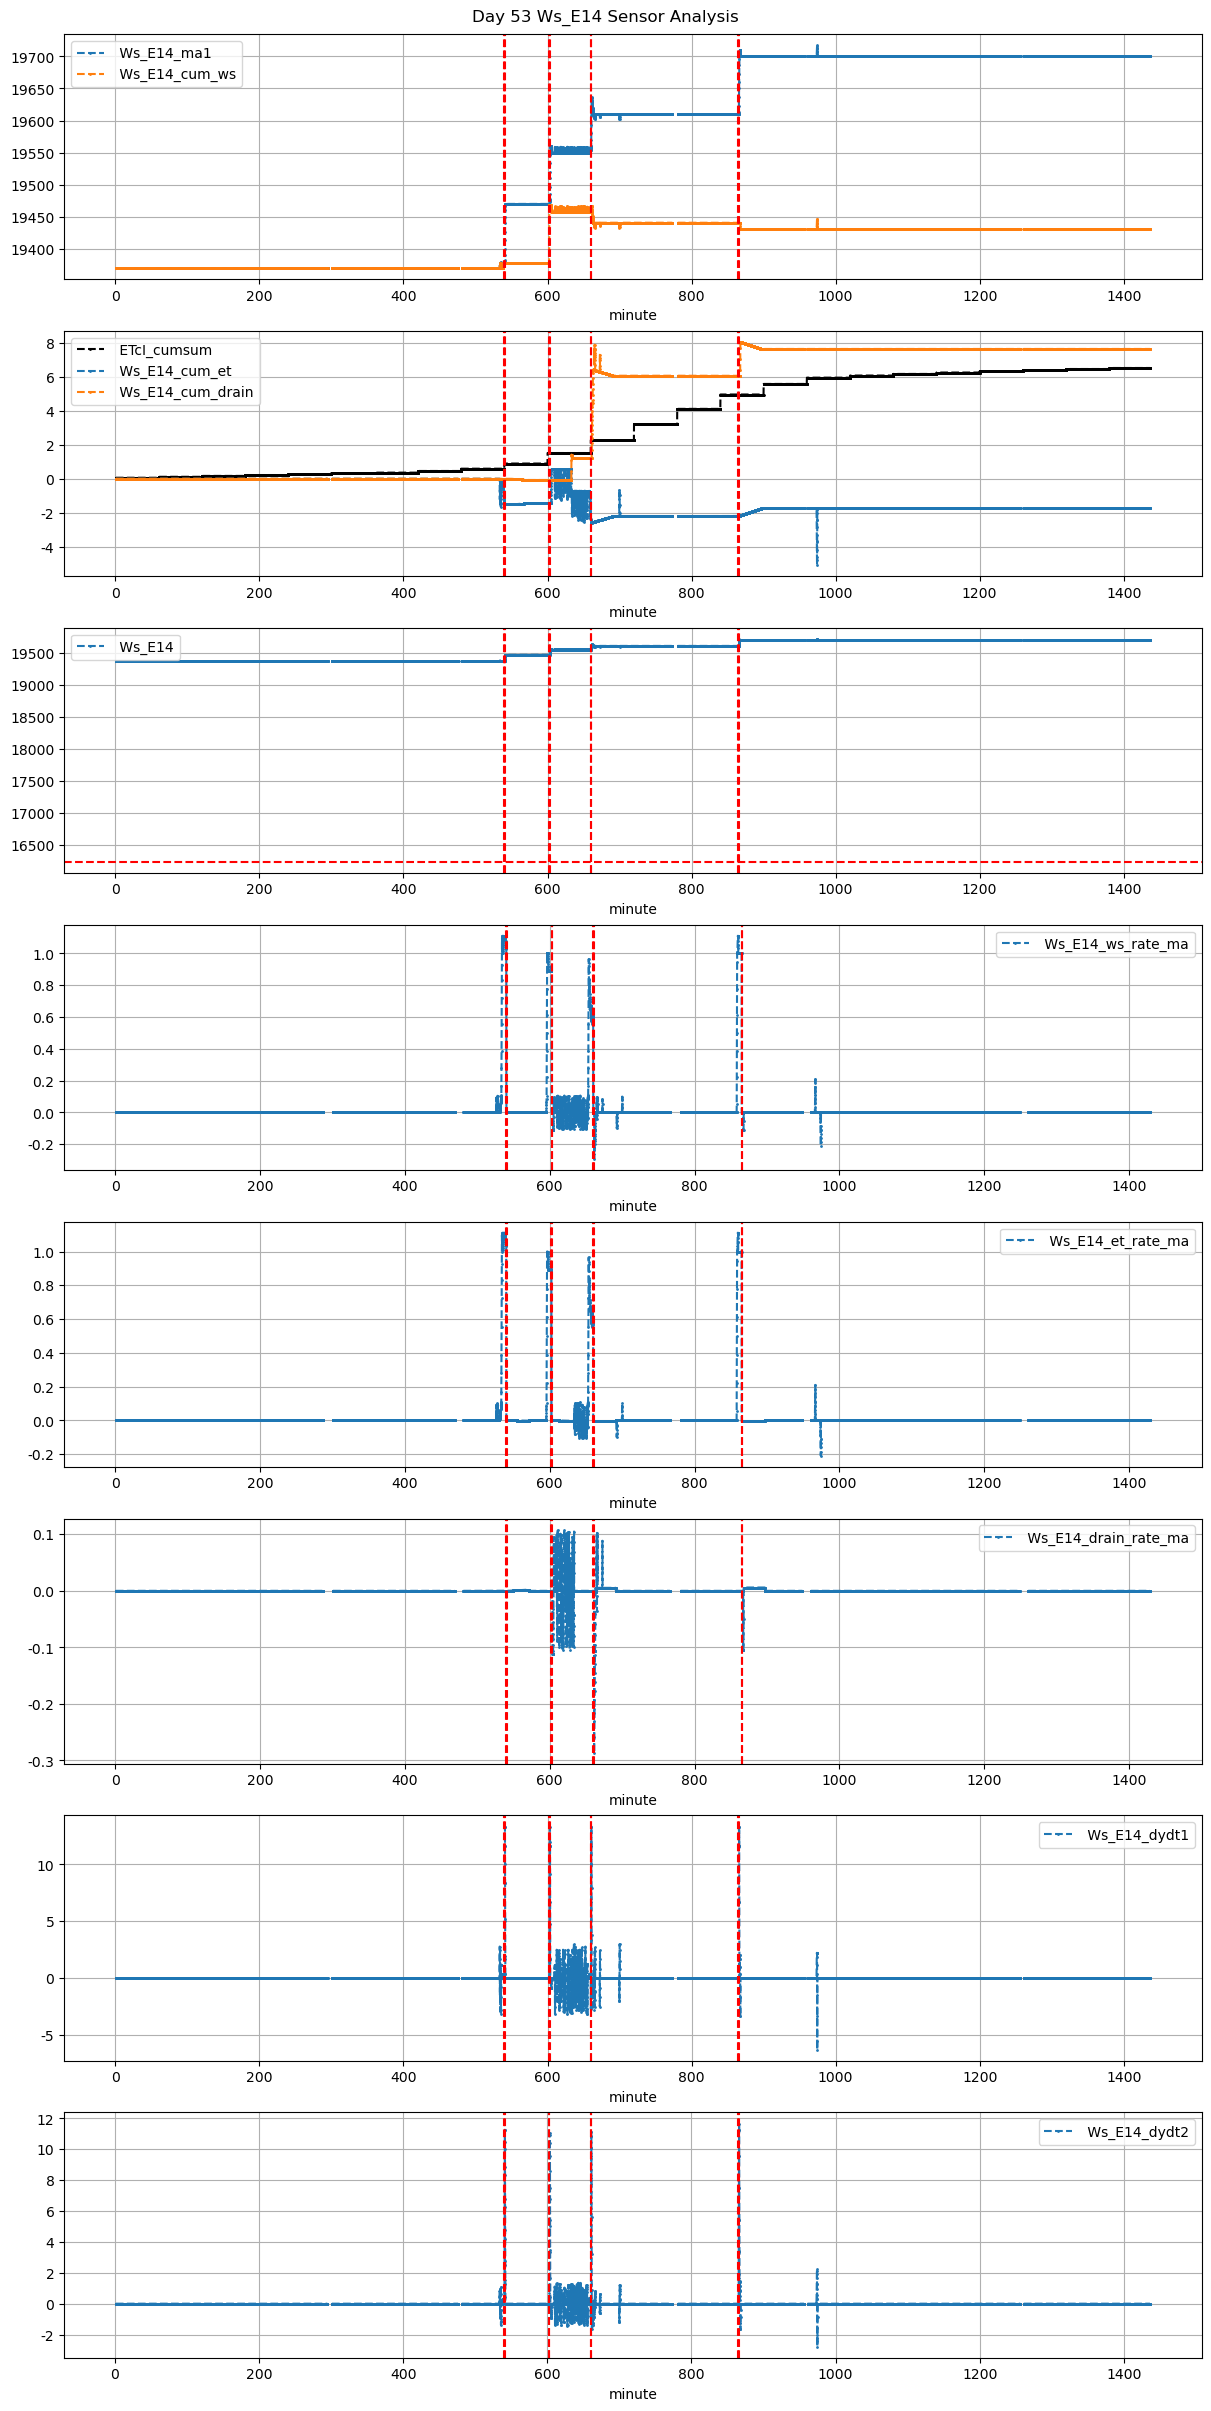
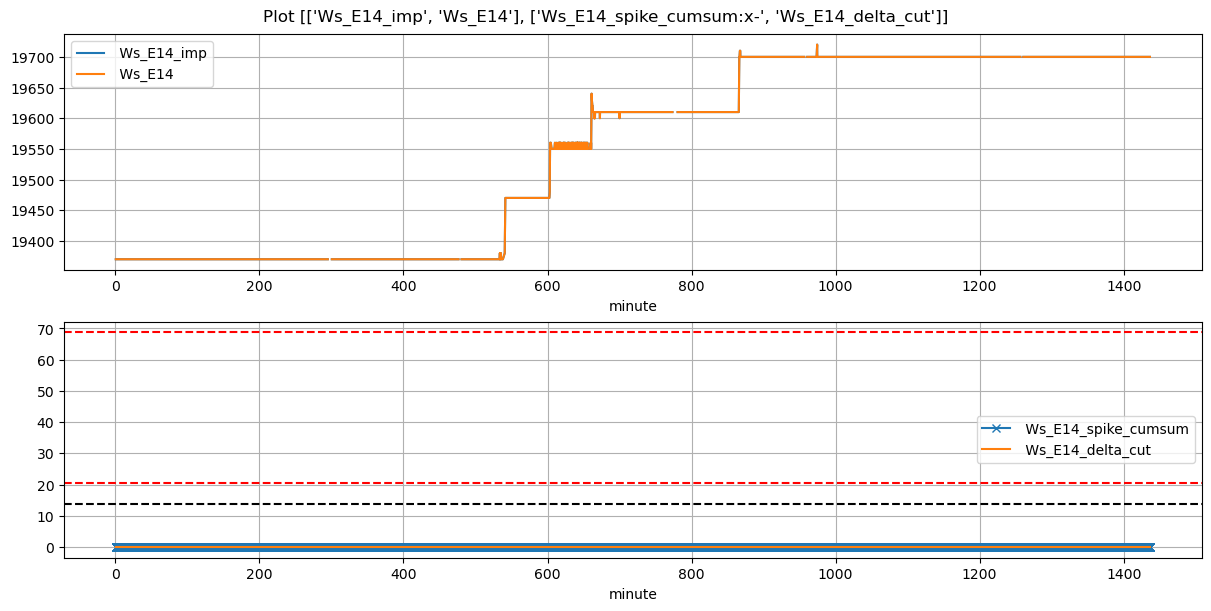
Ws_E14 |
2.160084 |
30 |
540.0 |
540.583333 |
540.57 |
541.333333 |
19370.0 |
19470.0 |
34 |
-0.002105 |
0.000000 |
-0.002105 |
0.424624 |
0.588235 |
20.0 |
False |
35.0 |
45.8 |
NaN |
0.0 |
0.0 |
0.0 |
NaN |
NaN |
NaN |
NaN |
NaN |
NaN |
| 2025-11-28 10:02:24+08:00 |
53 |
602 |
Ws_E14 |
2.160084 |
30 |
602.4 |
602.916667 |
602.97 |
603.666667 |
19470.0 |
19560.0 |
34 |
0.000000 |
-0.002469 |
-0.003086 |
0.420556 |
0.529412 |
18.0 |
True |
31.0 |
41.8 |
19.006 |
0.0 |
0.0 |
0.0 |
90.0 |
46.0 |
-0.111055 |
NaN |
NaN |
NaN |
| 2025-11-28 11:00:00+08:00 |
53 |
660 |
Ws_E14 |
2.160084 |
30 |
660.0 |
660.583333 |
660.57 |
661.250000 |
19550.0 |
19637.5 |
34 |
-0.005275 |
-0.029630 |
-0.005275 |
0.415833 |
0.514706 |
17.5 |
False |
35.0 |
40.8 |
NaN |
NaN |
NaN |
NaN |
NaN |
NaN |
NaN |
NaN |
NaN |
NaN |
| 2025-11-28 14:25:00+08:00 |
53 |
865 |
Ws_E14 |
2.160084 |
30 |
865.0 |
865.583333 |
865.57 |
867.083333 |
19610.0 |
19710.0 |
34 |
-0.005879 |
-0.009259 |
-0.005879 |
0.383333 |
0.588235 |
20.0 |
False |
35.0 |
90.8 |
NaN |
NaN |
NaN |
NaN |
NaN |
NaN |
NaN |
NaN |
NaN |
NaN |