| 2025-11-29 08:50:00+08:00 |
54 |
530 |
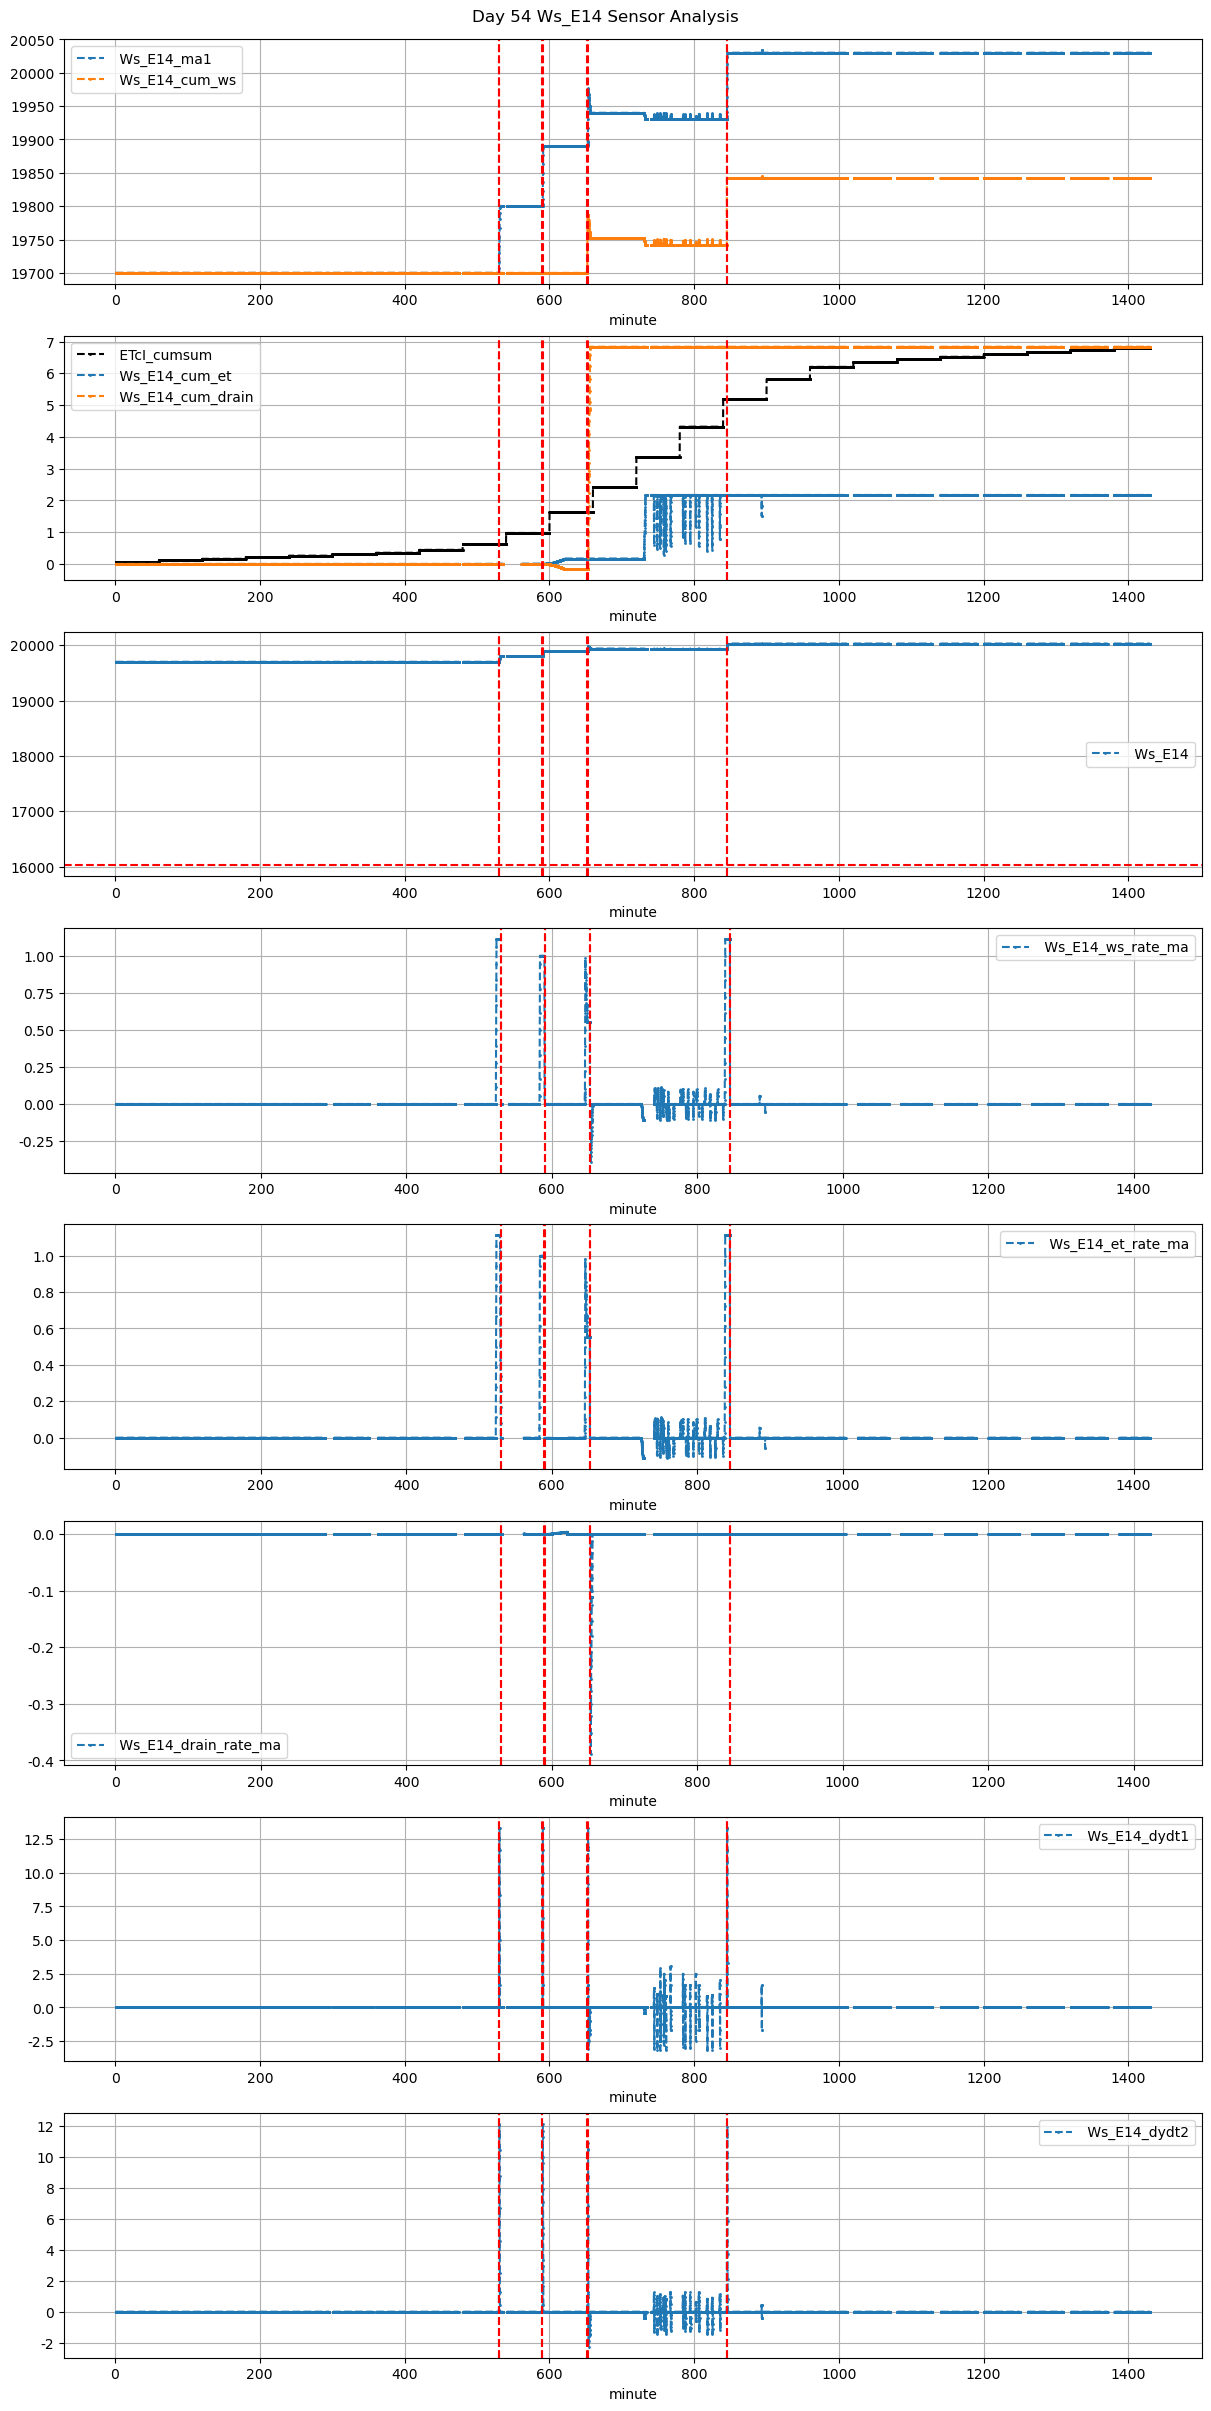
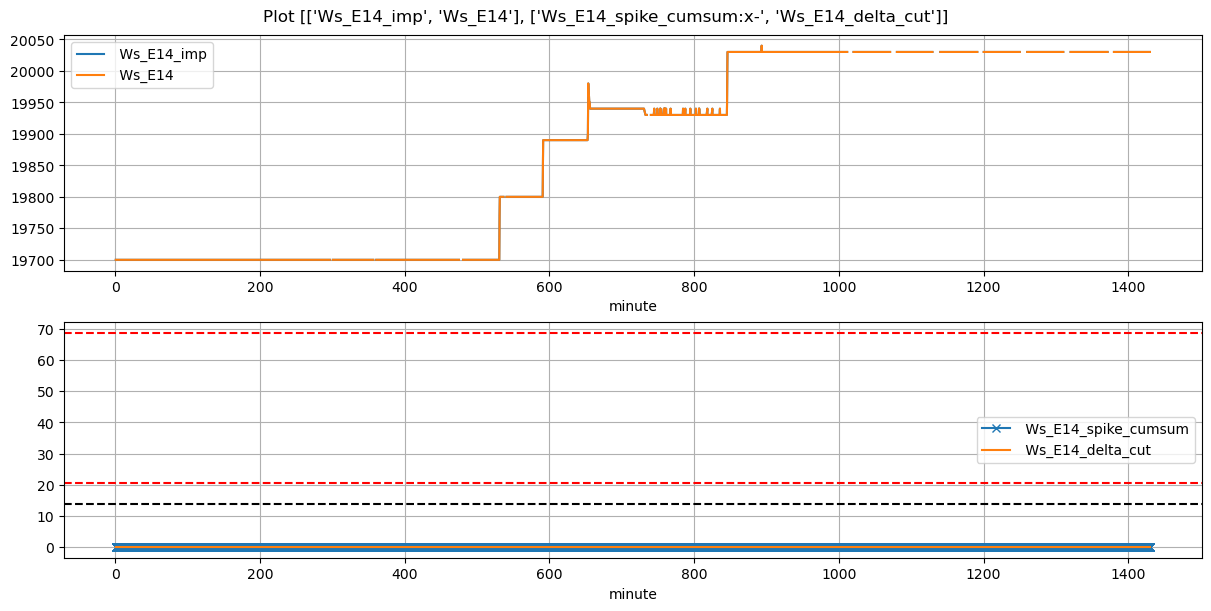
Ws_E14 |
2.213052 |
30 |
530.0 |
530.583333 |
530.57 |
531.333333 |
19700.0 |
19800.000000 |
34 |
-0.002463 |
NaN |
-0.002463 |
0.453333 |
0.588235 |
20.000000 |
False |
35.0 |
45.8 |
NaN |
0.0 |
0.0 |
0.0 |
NaN |
NaN |
NaN |
NaN |
NaN |
NaN |
| 2025-11-29 09:50:00+08:00 |
54 |
590 |
Ws_E14 |
2.213052 |
30 |
590.0 |
590.666667 |
590.57 |
591.250000 |
19800.0 |
19890.000000 |
34 |
-0.004516 |
0.000000 |
-0.004516 |
0.460000 |
0.529412 |
18.000000 |
False |
40.0 |
40.8 |
NaN |
0.0 |
0.0 |
0.0 |
NaN |
NaN |
NaN |
NaN |
NaN |
NaN |
| 2025-11-29 10:52:24+08:00 |
54 |
652 |
Ws_E14 |
2.213052 |
30 |
652.4 |
652.916667 |
652.97 |
653.666667 |
19890.0 |
19976.666667 |
34 |
0.000000 |
-0.058642 |
0.000000 |
0.417222 |
0.509804 |
17.333333 |
True |
31.0 |
41.8 |
19.006 |
0.0 |
0.0 |
0.0 |
140.0 |
46.0 |
-0.341481 |
NaN |
NaN |
NaN |
| 2025-11-29 14:05:00+08:00 |
54 |
845 |
Ws_E14 |
2.213052 |
30 |
845.0 |
845.250000 |
845.57 |
846.000000 |
19930.0 |
20030.000000 |
34 |
-0.003745 |
0.000000 |
0.000000 |
0.451667 |
0.588235 |
20.000000 |
True |
15.0 |
25.8 |
20.000 |
0.0 |
0.0 |
0.0 |
NaN |
NaN |
NaN |
NaN |
NaN |
NaN |