| 2025-11-27 08:50:00+08:00 |
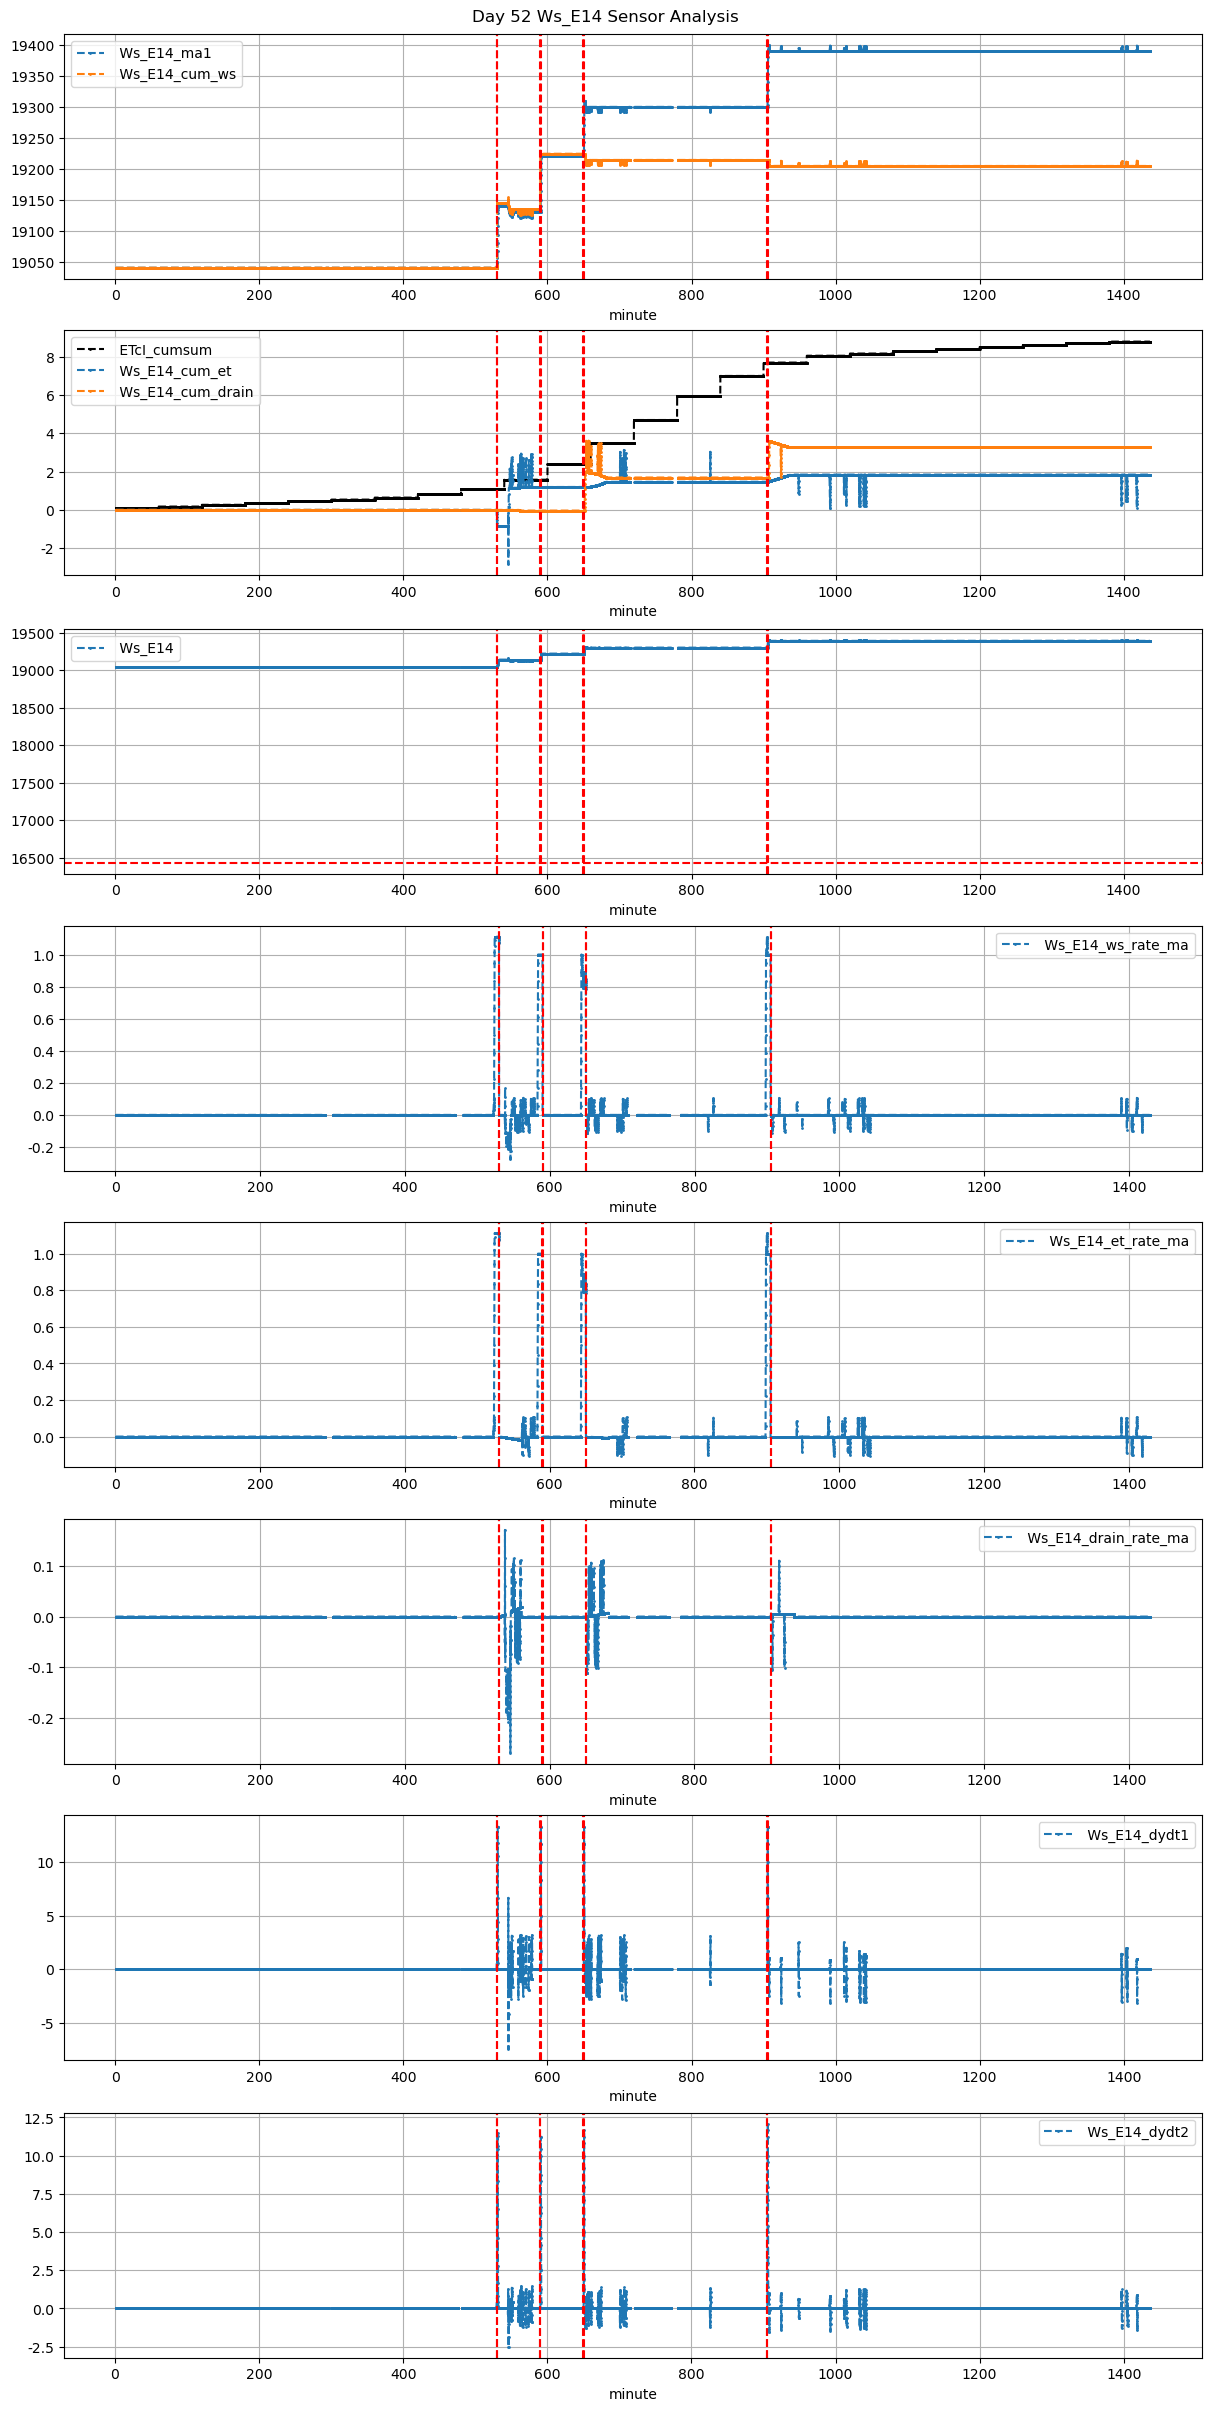
52 |
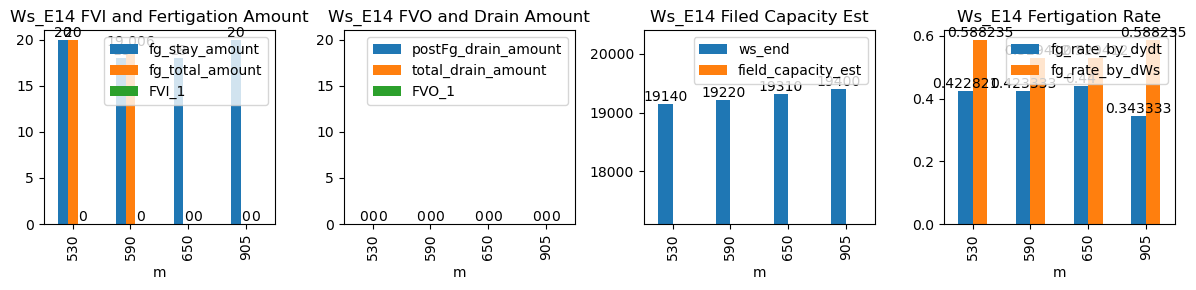
530 |
Ws_E14 |
2.058332 |
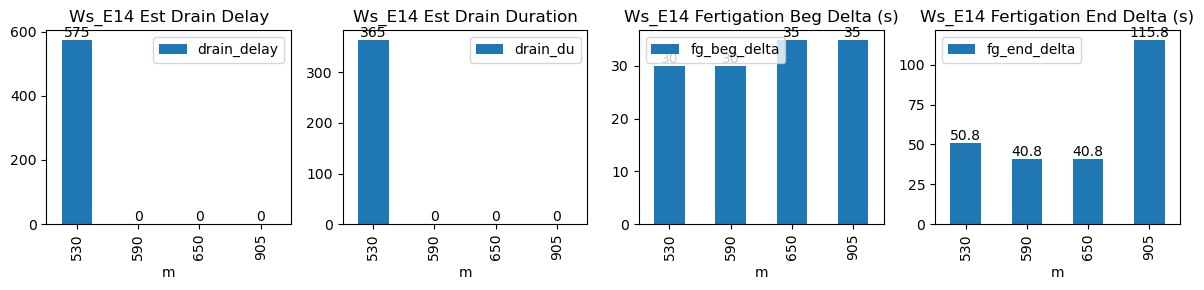
30 |
530.0 |
530.500000 |
530.57 |
531.416667 |
19040.0 |
19140.0 |
34 |
0.000000 |
-0.002469 |
-0.019136 |
0.422821 |
0.588235 |
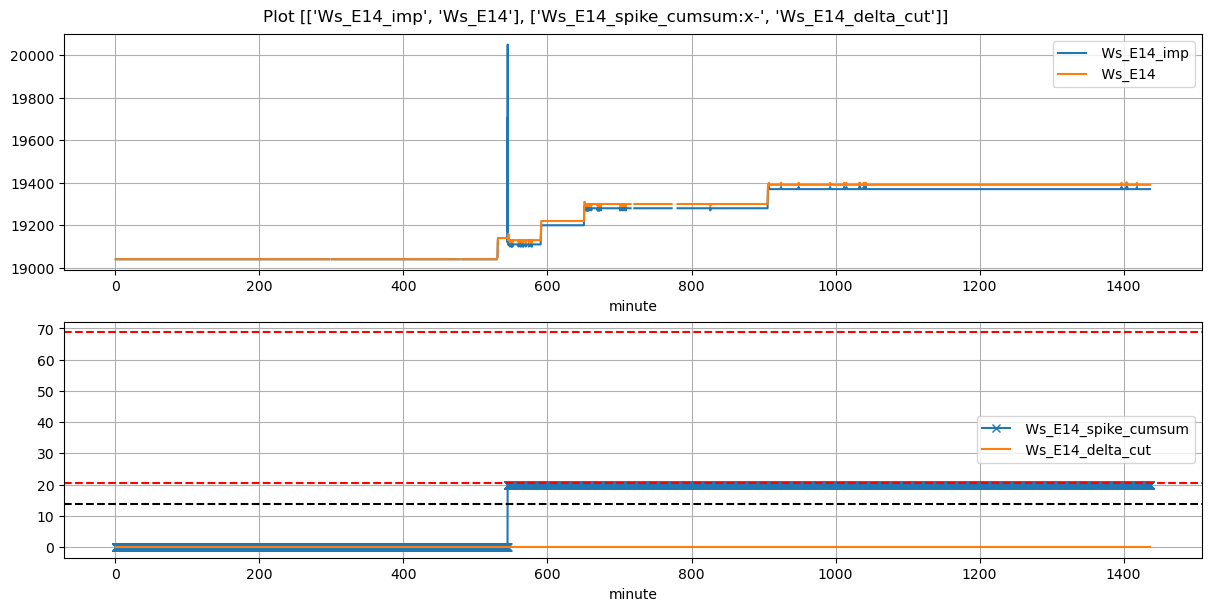
20.0 |
True |
30.0 |
50.8 |
20.000 |
0.0 |
0.0 |
0.0 |
365.0 |
575.0 |
-0.173971 |
NaN |
NaN |
NaN |
| 2025-11-27 09:50:00+08:00 |
52 |
590 |
Ws_E14 |
2.058332 |
30 |
590.0 |
590.500000 |
590.57 |
591.250000 |
19130.0 |
19220.0 |
34 |
0.000000 |
0.000000 |
0.000000 |
0.423333 |
0.529412 |
18.0 |
True |
30.0 |
40.8 |
19.006 |
0.0 |
0.0 |
0.0 |
NaN |
NaN |
NaN |
NaN |
NaN |
NaN |
| 2025-11-27 10:50:00+08:00 |
52 |
650 |
Ws_E14 |
2.058332 |
30 |
650.0 |
650.583333 |
650.57 |
651.250000 |
19220.0 |
19310.0 |
34 |
-0.007576 |
0.000000 |
-0.007576 |
0.440000 |
0.529412 |
18.0 |
False |
35.0 |
40.8 |
NaN |
NaN |
NaN |
NaN |
NaN |
NaN |
NaN |
NaN |
NaN |
NaN |
| 2025-11-27 15:05:00+08:00 |
52 |
905 |
Ws_E14 |
2.058332 |
30 |
905.0 |
905.583333 |
905.57 |
907.500000 |
19300.0 |
19400.0 |
34 |
-0.004850 |
-0.004938 |
-0.004850 |
0.343333 |
0.588235 |
20.0 |
False |
35.0 |
115.8 |
NaN |
NaN |
NaN |
NaN |
NaN |
NaN |
NaN |
NaN |
NaN |
NaN |