| 2025-11-26 08:45:00+08:00 |
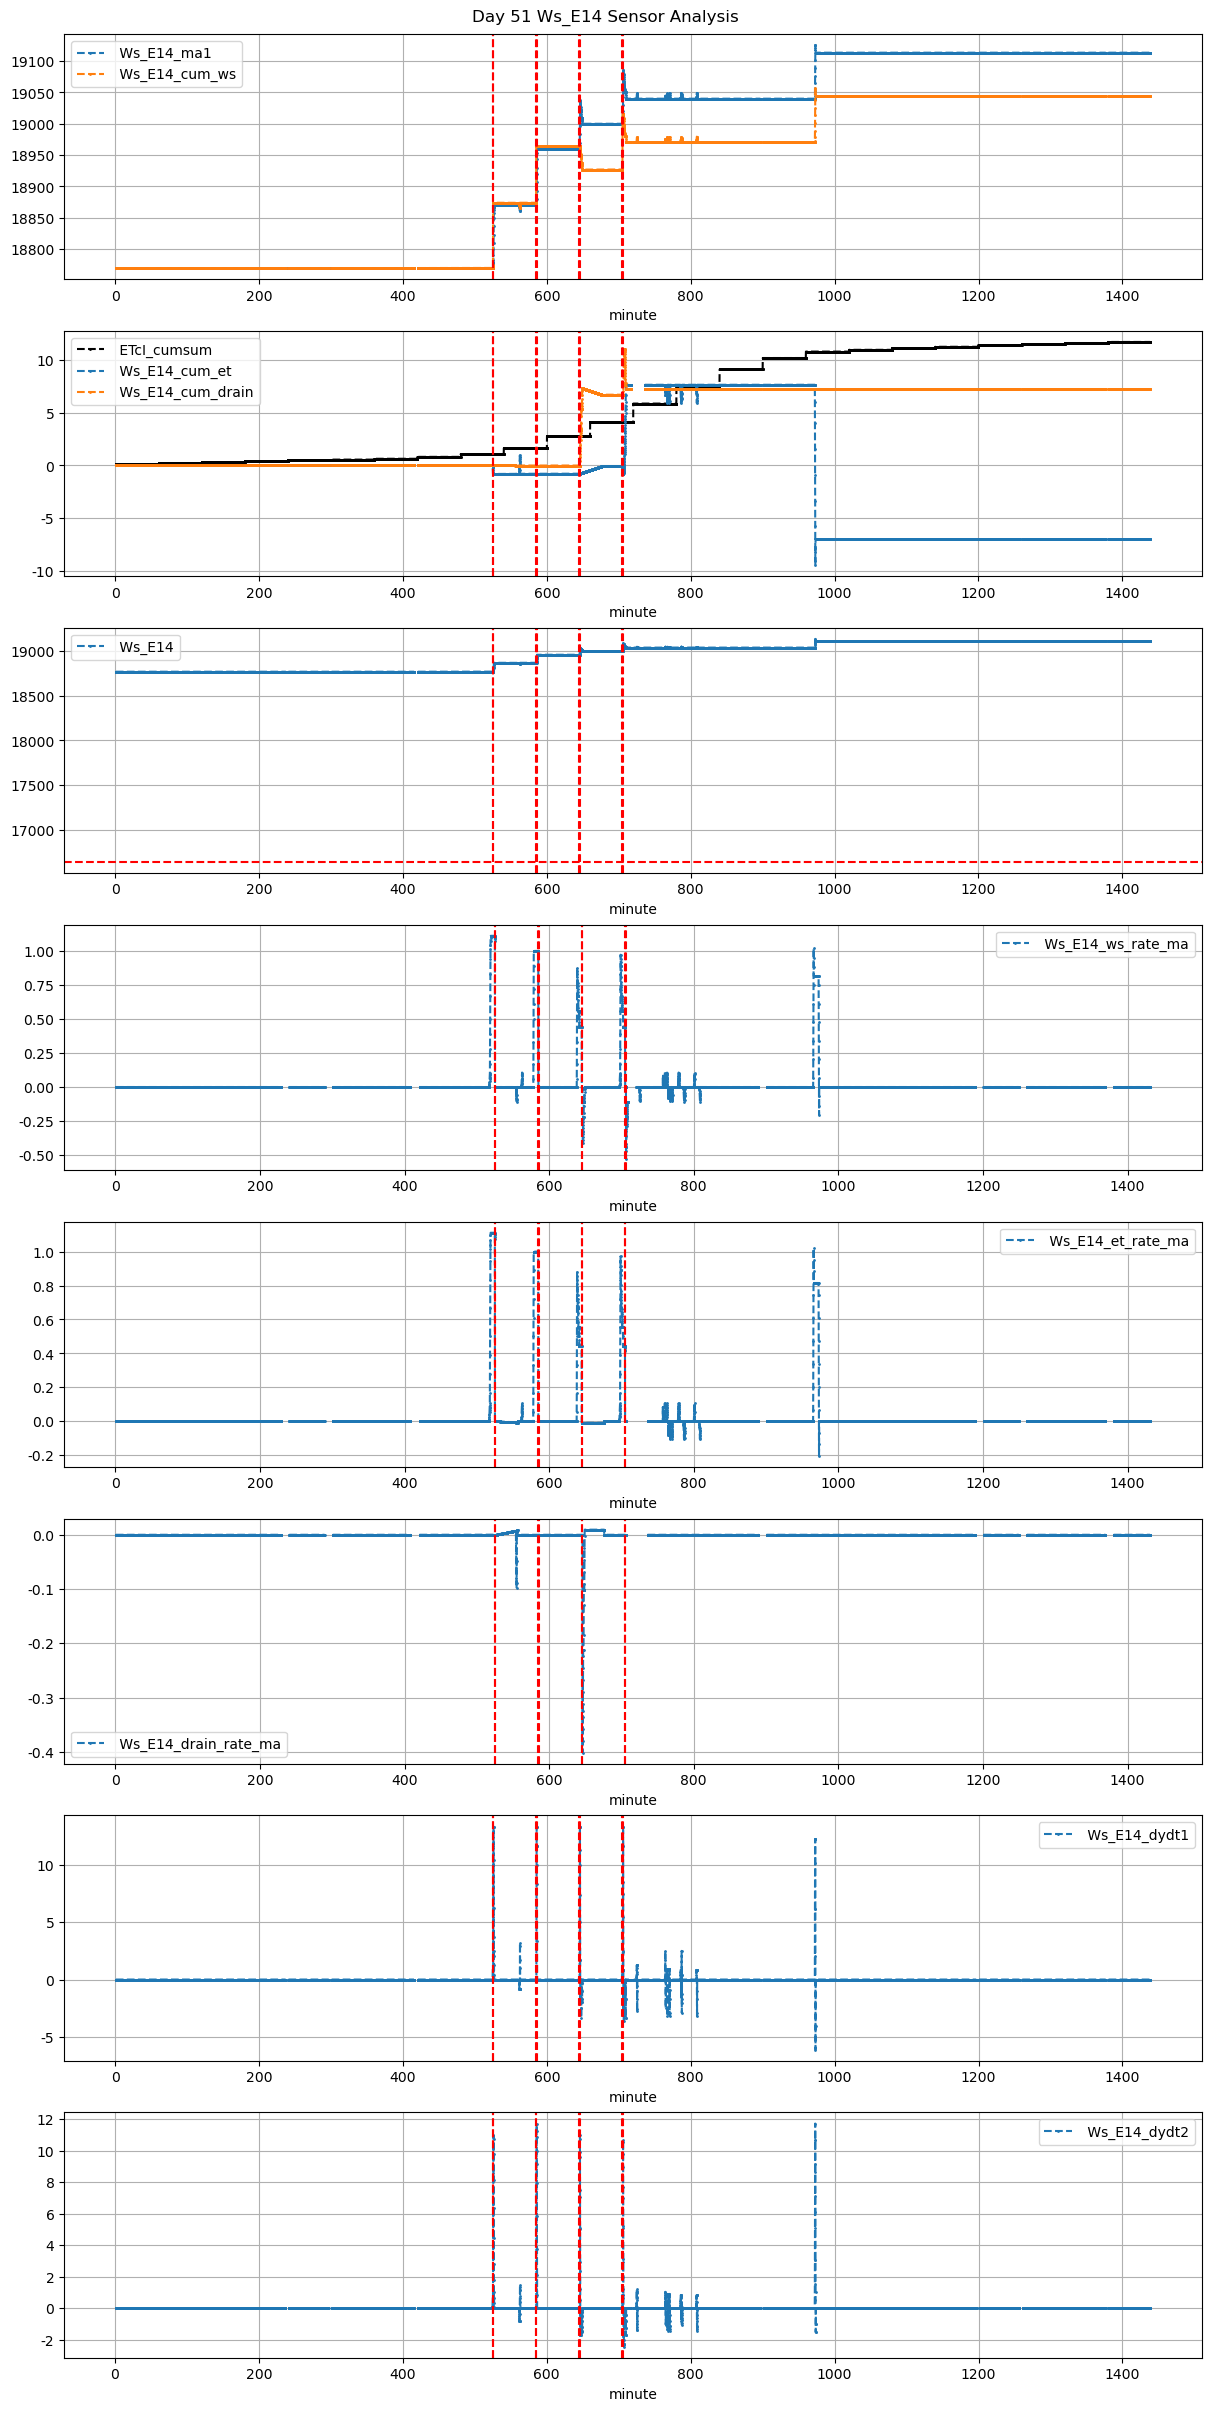
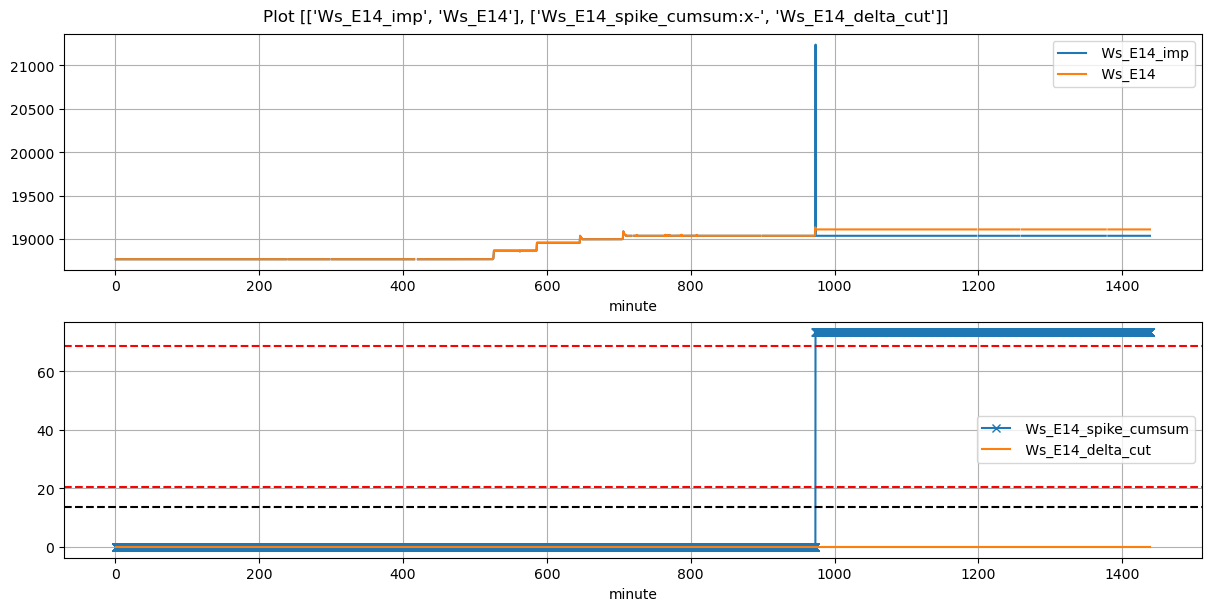
51 |
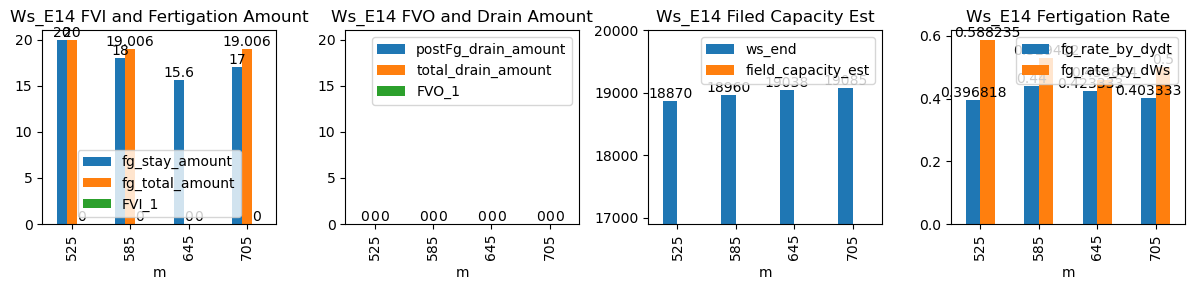
525 |
Ws_E14 |
2.739746 |
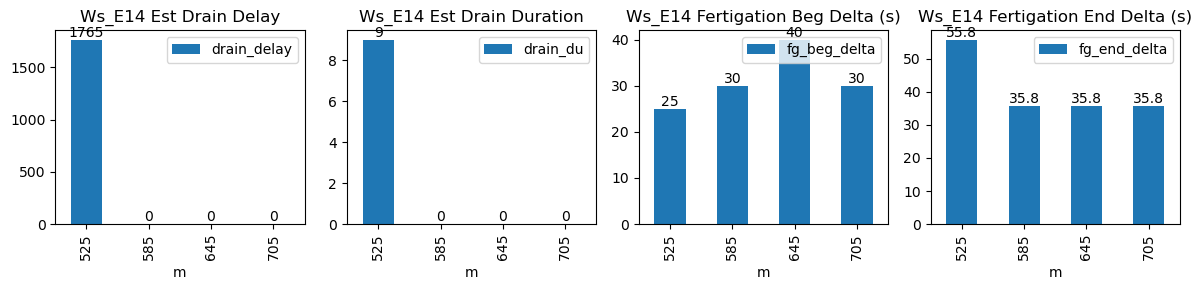
30 |
525.0 |
525.416667 |
525.57 |
526.500000 |
18770.0 |
18870.0 |
34 |
0.000000 |
0.000000 |
-0.008025 |
0.396818 |
0.588235 |
20.0 |
True |
25.0 |
55.8 |
20.000 |
0.0 |
0.0 |
0.0 |
9.0 |
1765.0 |
-0.093756 |
NaN |
NaN |
NaN |
| 2025-11-26 09:45:00+08:00 |
51 |
585 |
Ws_E14 |
2.739746 |
30 |
585.0 |
585.500000 |
585.57 |
586.166667 |
18870.0 |
18960.0 |
34 |
0.000000 |
0.000000 |
0.000000 |
0.440000 |
0.529412 |
18.0 |
True |
30.0 |
35.8 |
19.006 |
0.0 |
0.0 |
0.0 |
NaN |
NaN |
NaN |
NaN |
NaN |
NaN |
| 2025-11-26 10:45:00+08:00 |
51 |
645 |
Ws_E14 |
2.739746 |
30 |
645.0 |
645.666667 |
645.57 |
646.166667 |
18960.0 |
19038.0 |
34 |
-0.009393 |
-0.077160 |
-0.009393 |
0.423333 |
0.458824 |
15.6 |
False |
40.0 |
35.8 |
NaN |
0.0 |
0.0 |
0.0 |
NaN |
NaN |
NaN |
NaN |
NaN |
NaN |
| 2025-11-26 11:45:00+08:00 |
51 |
705 |
Ws_E14 |
2.739746 |
30 |
705.0 |
705.500000 |
705.57 |
706.166667 |
19000.0 |
19085.0 |
34 |
0.000000 |
-0.226389 |
0.000000 |
0.403333 |
0.500000 |
17.0 |
True |
30.0 |
35.8 |
19.006 |
0.0 |
0.0 |
0.0 |
NaN |
NaN |
NaN |
NaN |
NaN |
NaN |