| 2025-11-25 08:51:04+08:00 |
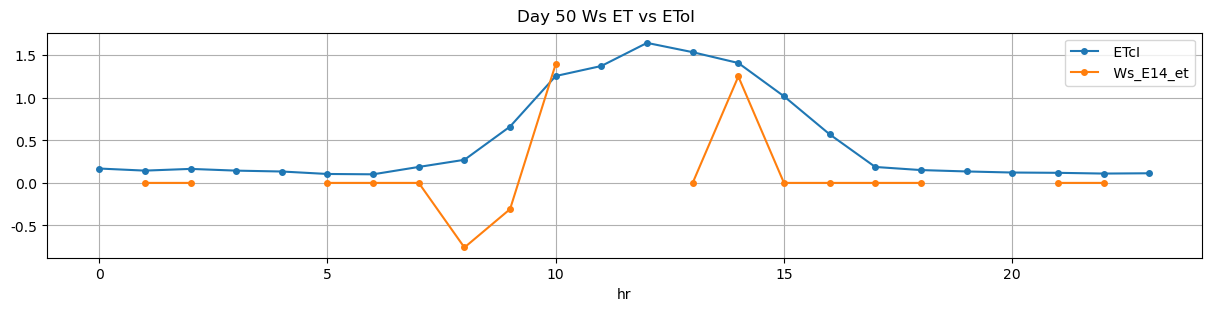
50 |
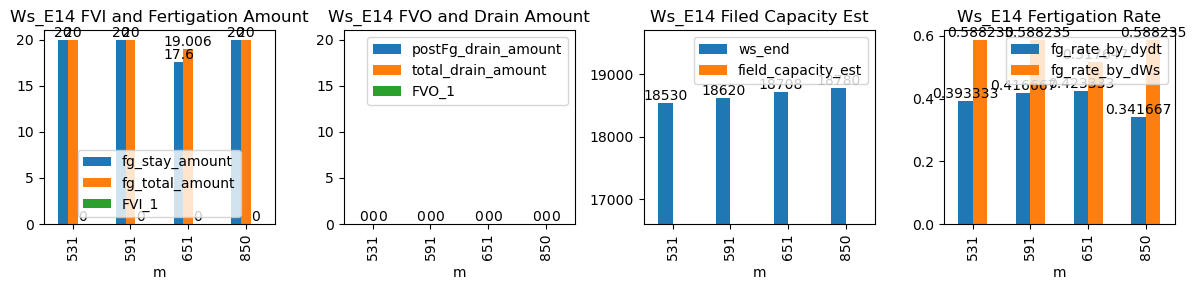
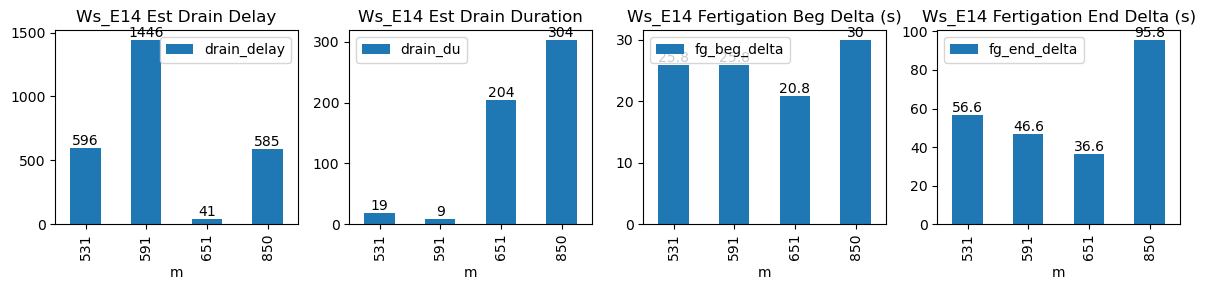
531 |
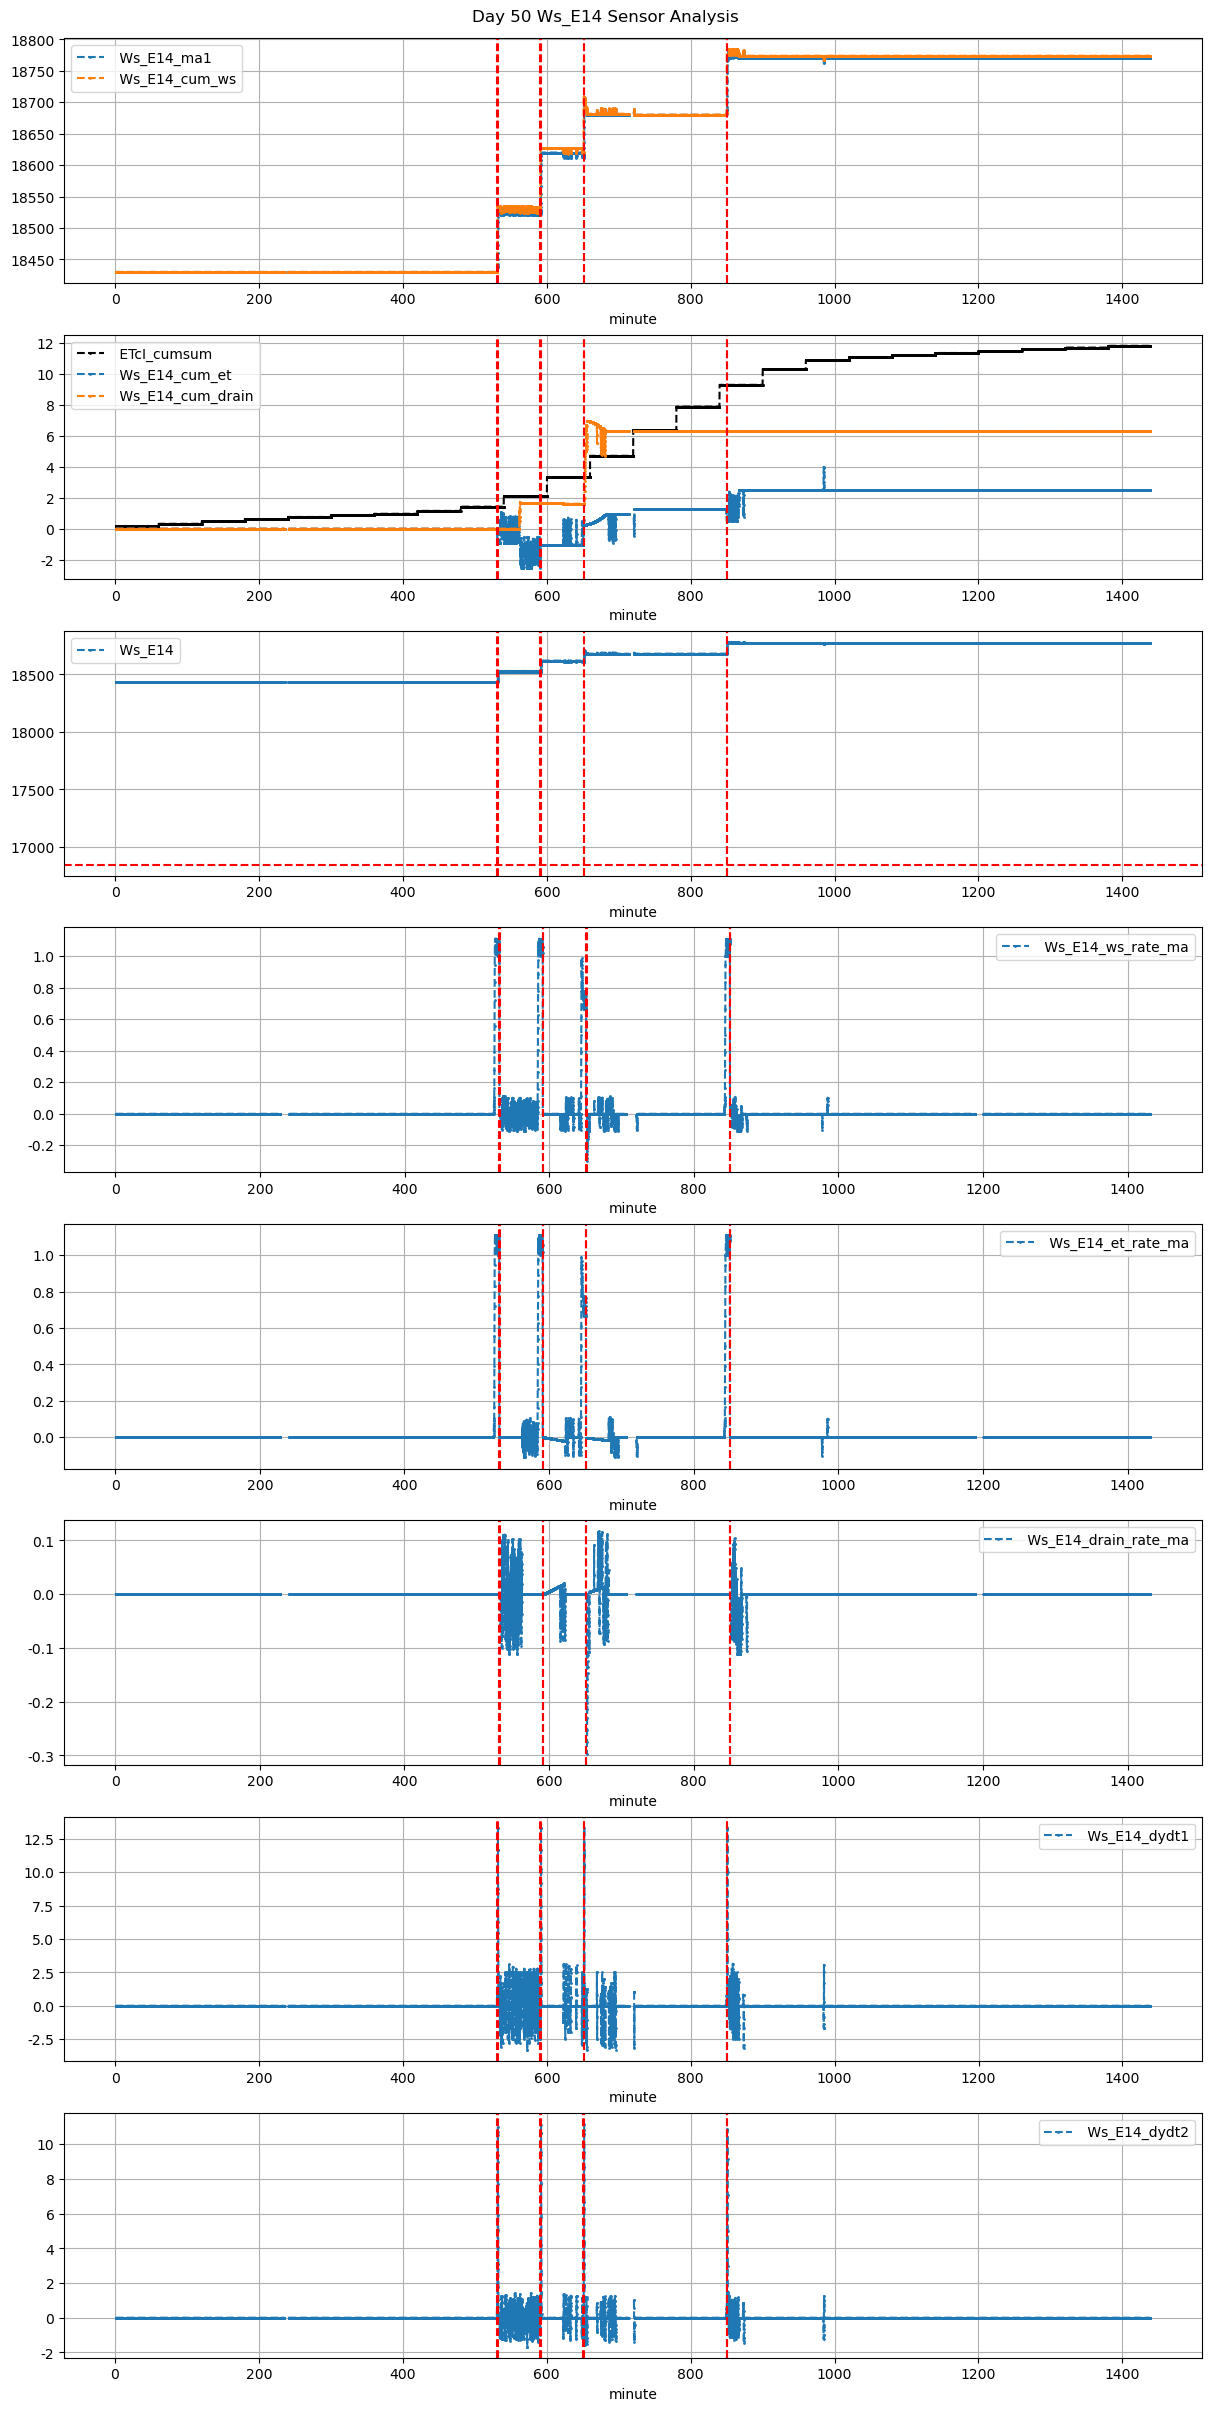
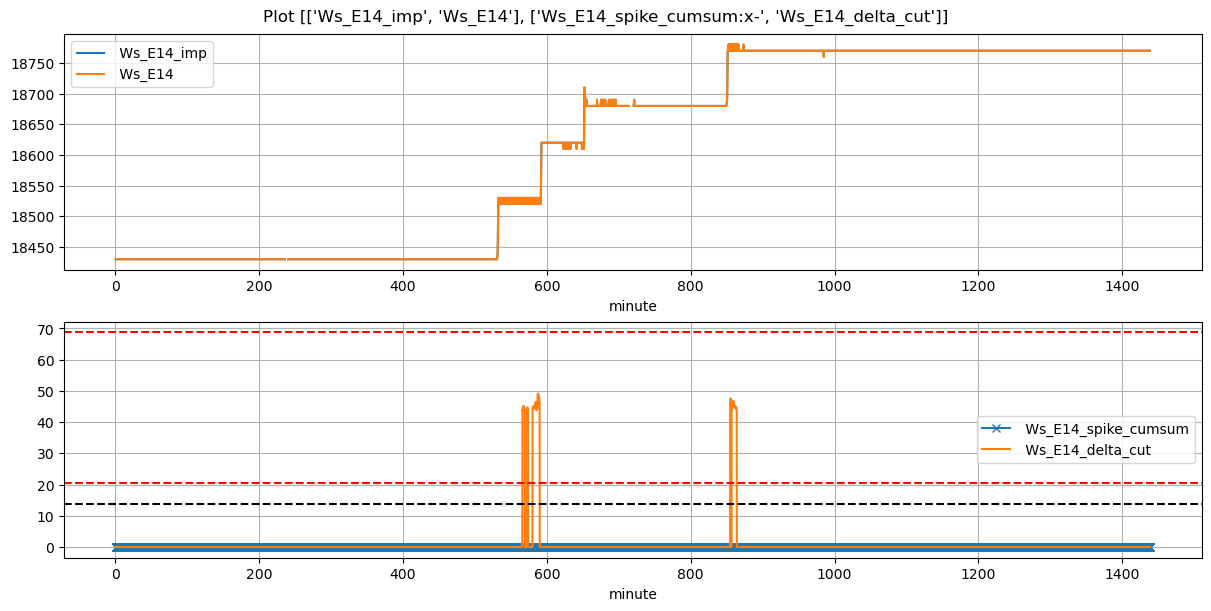
Ws_E14 |
1.921228 |
30 |
531.07 |
531.500000 |
531.64 |
532.583333 |
18430.0 |
18530.0 |
34 |
0.000000 |
0.000000 |
0.000000 |
0.393333 |
0.588235 |
20.0 |
True |
25.8 |
56.6 |
20.000 |
0.0 |
0.0 |
0.0 |
19 |
596 |
-0.101852 |
NaN |
NaN |
NaN |
| 2025-11-25 09:51:04+08:00 |
50 |
591 |
Ws_E14 |
1.921228 |
30 |
591.07 |
591.500000 |
591.64 |
592.416667 |
18520.0 |
18620.0 |
34 |
-0.012963 |
0.000000 |
-0.020864 |
0.416667 |
0.588235 |
20.0 |
True |
25.8 |
46.6 |
20.000 |
0.0 |
0.0 |
0.0 |
9 |
1446 |
-0.084162 |
NaN |
NaN |
NaN |
| 2025-11-25 10:51:04+08:00 |
50 |
651 |
Ws_E14 |
1.921228 |
30 |
651.07 |
651.416667 |
651.64 |
652.250000 |
18620.0 |
18708.0 |
34 |
-0.002778 |
-0.059877 |
-0.016648 |
0.423333 |
0.517647 |
17.6 |
True |
20.8 |
36.6 |
19.006 |
0.0 |
0.0 |
0.0 |
204 |
41 |
-0.212581 |
NaN |
NaN |
NaN |
| 2025-11-25 14:10:00+08:00 |
50 |
850 |
Ws_E14 |
1.921228 |
30 |
850.00 |
850.500000 |
850.57 |
852.166667 |
18680.0 |
18780.0 |
34 |
0.000000 |
-0.001235 |
0.000000 |
0.341667 |
0.588235 |
20.0 |
True |
30.0 |
95.8 |
20.000 |
0.0 |
0.0 |
0.0 |
304 |
585 |
-0.111111 |
NaN |
NaN |
NaN |