| 2025-11-24 08:55:00+08:00 |
49 |
535 |
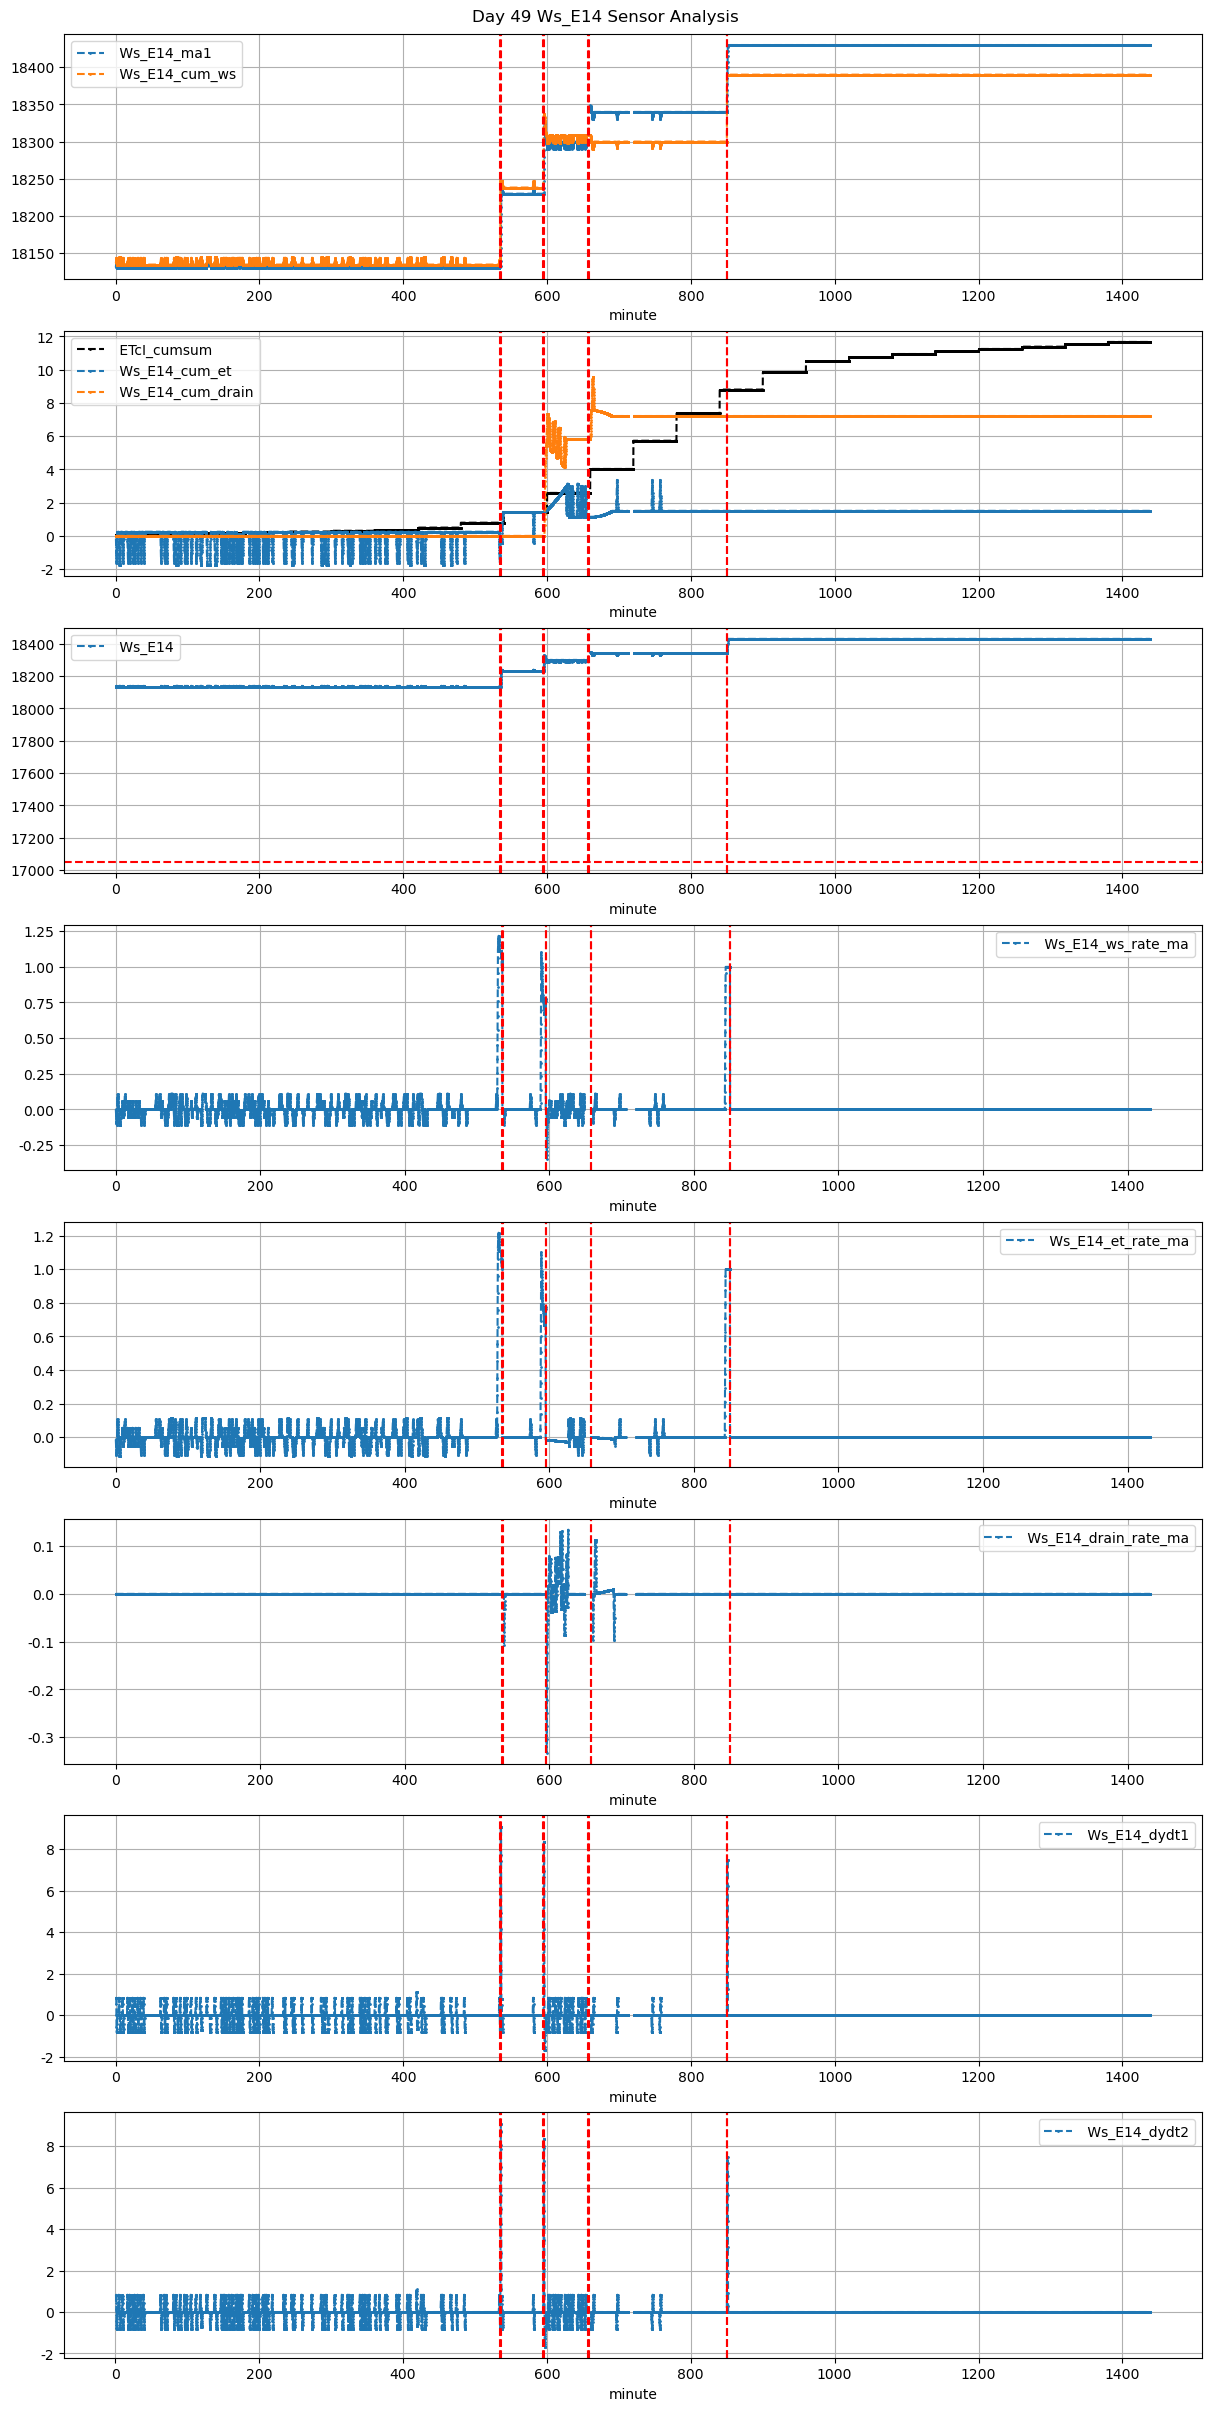
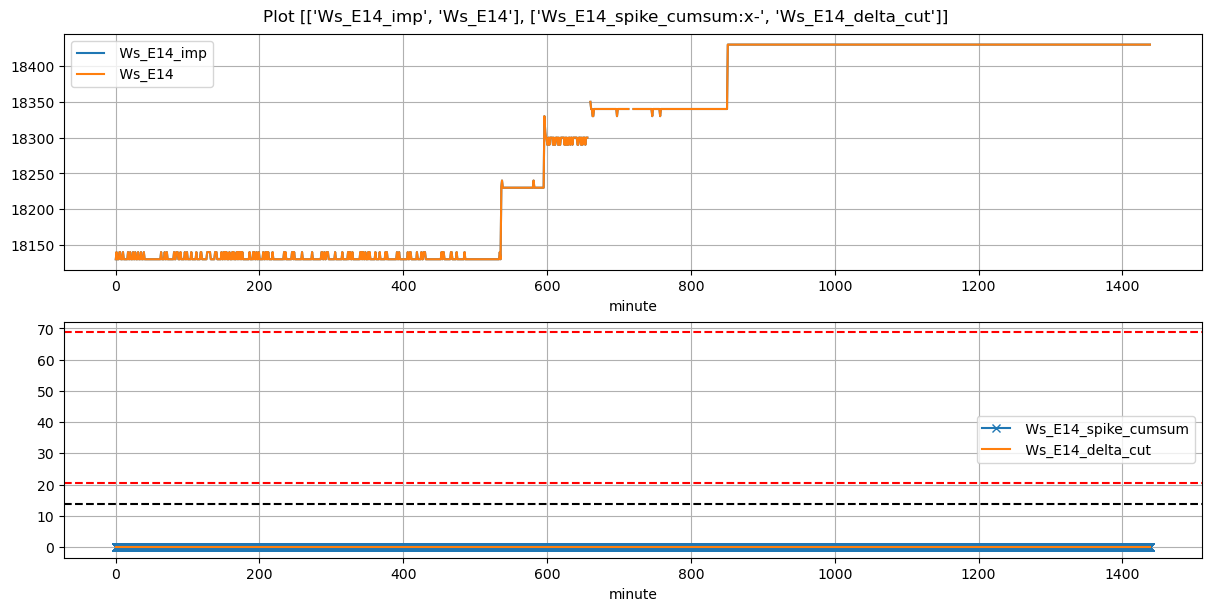
Ws_E14 |
1.452815 |
30 |
535.0 |
535.416667 |
535.57 |
537.333333 |
18130.000000 |
18239.465812 |
34 |
0.000000 |
-0.008594 |
0.000000 |
0.332098 |
0.643917 |
21.893162 |
True |
25.0 |
105.8 |
21.893162 |
0.0 |
0.0 |
0.0 |
60.0 |
110.0 |
-0.101389 |
NaN |
NaN |
NaN |
| 2025-11-24 09:55:00+08:00 |
49 |
595 |
Ws_E14 |
1.452815 |
30 |
595.0 |
595.250000 |
595.57 |
596.333333 |
18230.000000 |
18328.333333 |
34 |
-0.014981 |
-0.032099 |
-0.027778 |
0.333333 |
0.578431 |
19.666667 |
True |
15.0 |
45.8 |
19.666667 |
0.0 |
0.0 |
0.0 |
105.0 |
50.0 |
-0.169009 |
NaN |
NaN |
NaN |
| 2025-11-24 10:57:24+08:00 |
49 |
657 |
Ws_E14 |
1.452815 |
30 |
657.4 |
NaN |
657.97 |
660.333333 |
18296.333333 |
18349.166667 |
34 |
-0.010013 |
0.000000 |
-0.010013 |
NaN |
0.310784 |
10.566667 |
False |
NaN |
141.8 |
NaN |
0.0 |
0.0 |
0.0 |
NaN |
NaN |
NaN |
NaN |
NaN |
NaN |
| 2025-11-24 14:10:00+08:00 |
49 |
850 |
Ws_E14 |
1.452815 |
30 |
850.0 |
850.250000 |
850.57 |
851.333333 |
18340.000000 |
18430.000000 |
34 |
0.000000 |
0.000000 |
0.000000 |
0.300000 |
0.529412 |
18.000000 |
True |
15.0 |
45.8 |
19.006000 |
0.0 |
0.0 |
0.0 |
NaN |
NaN |
NaN |
NaN |
NaN |
NaN |