| 2025-11-23 09:01:04+08:00 |
48 |
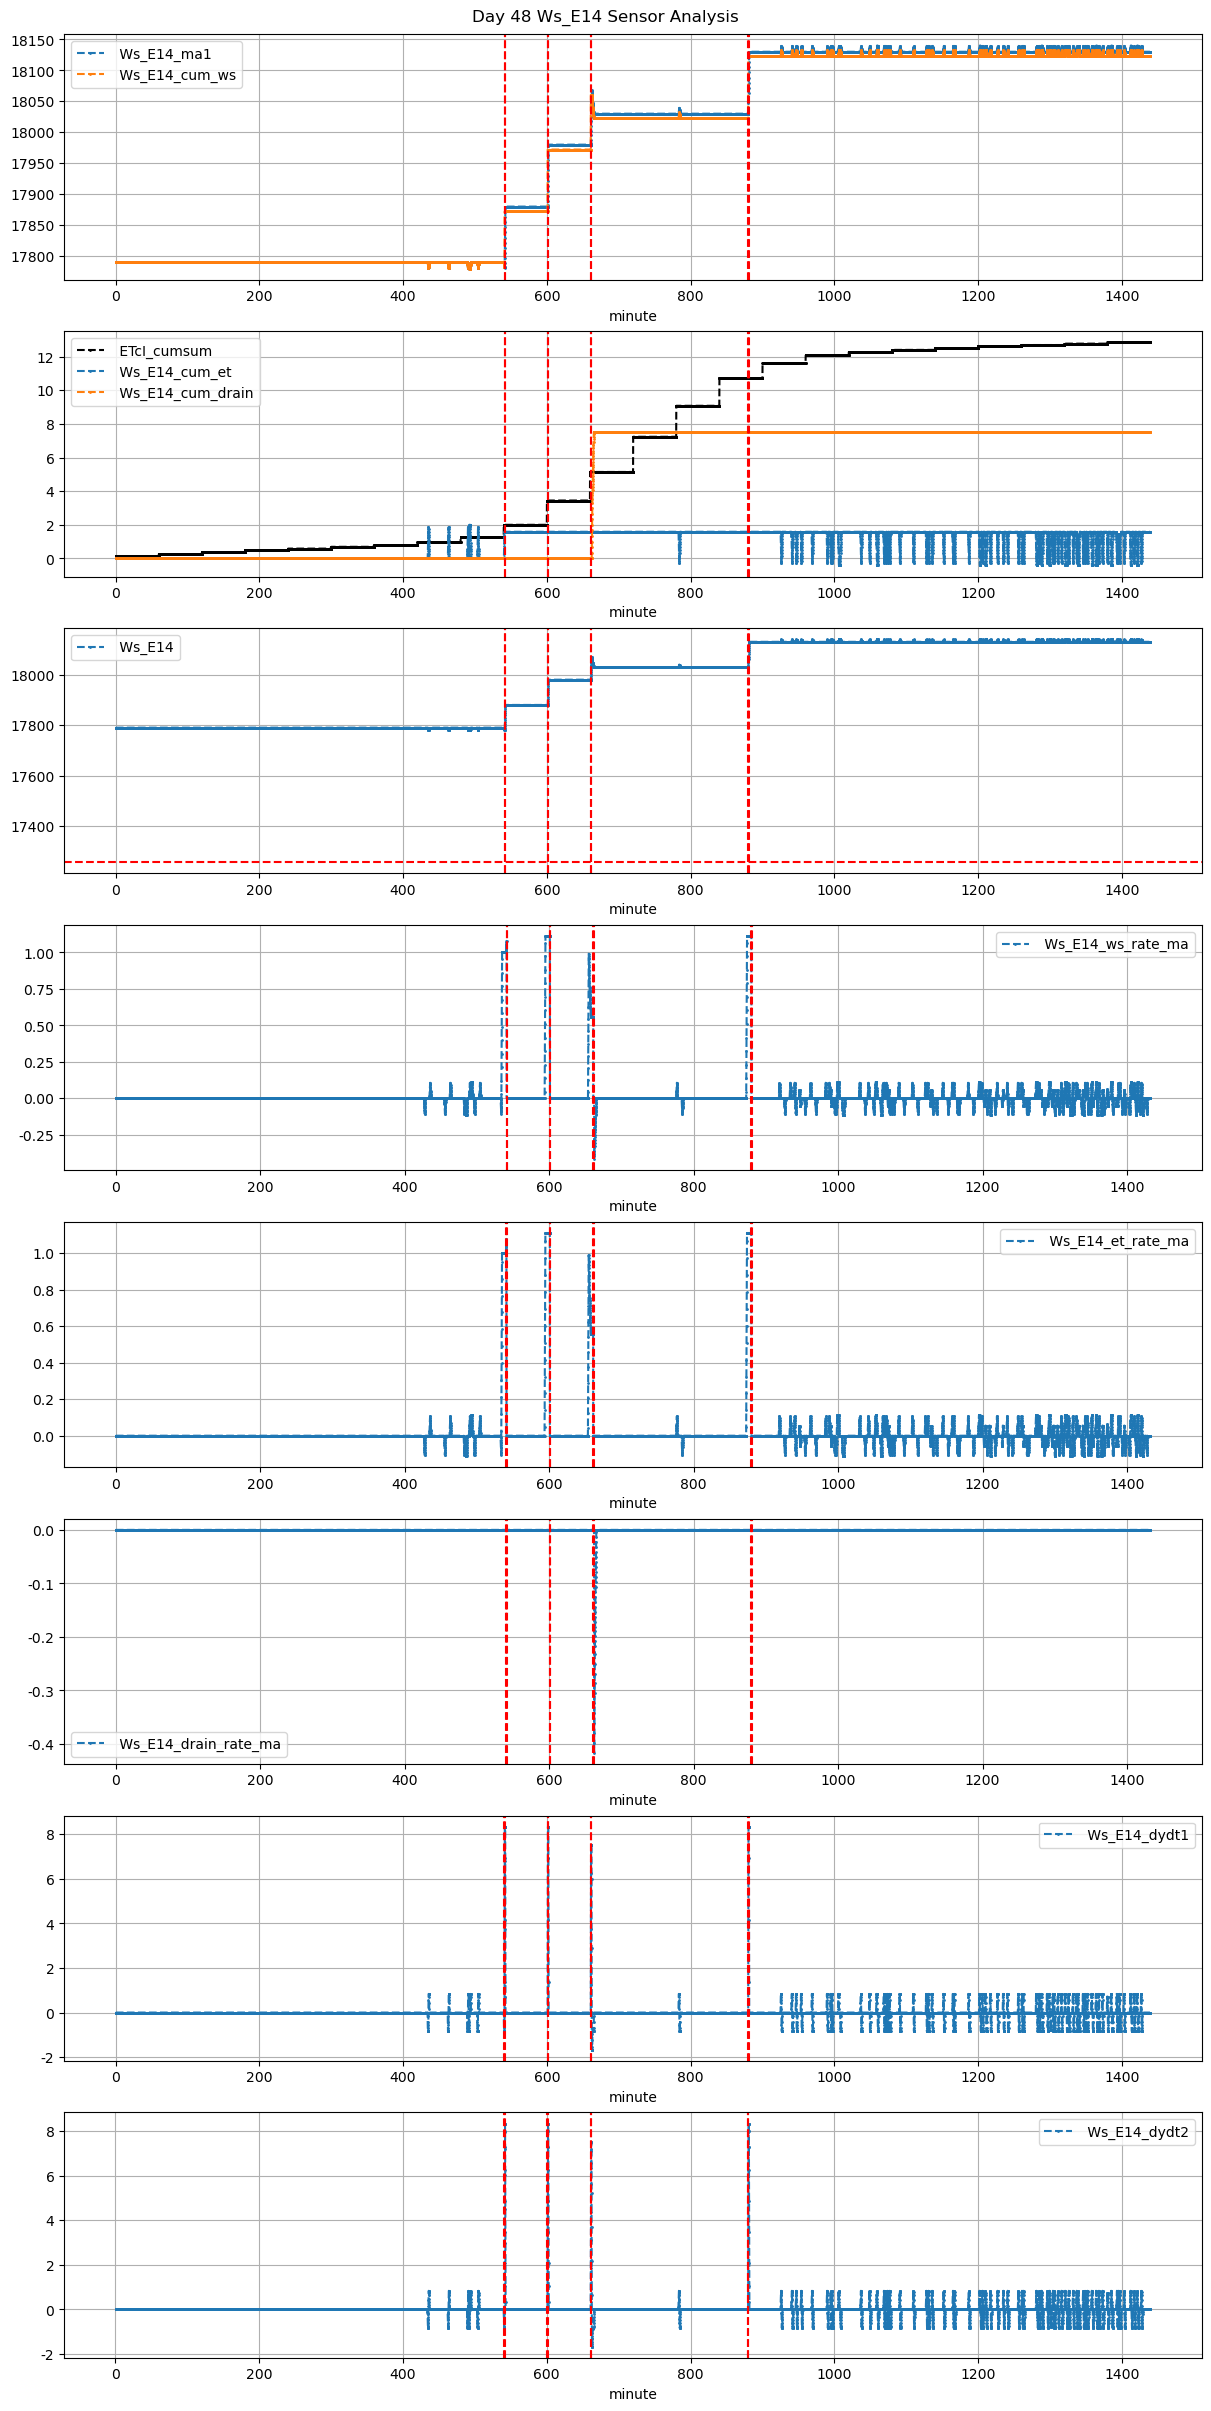
541 |
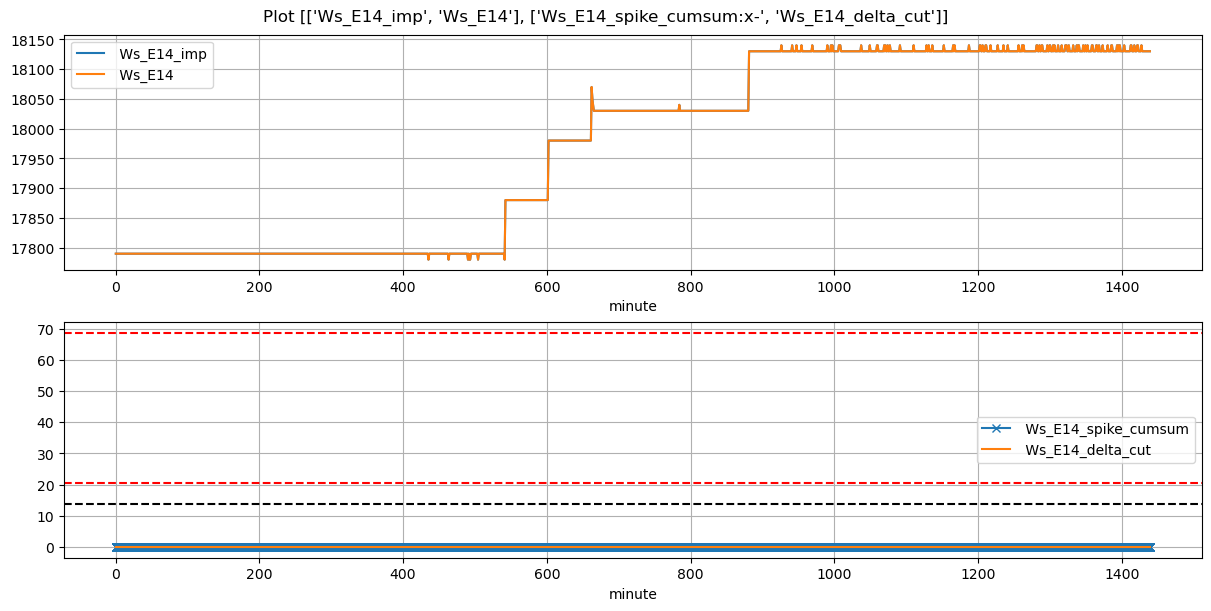
Ws_E14 |
1.486059 |
30 |
541.07 |
541.333333 |
541.64 |
542.333333 |
17790.0 |
17880.000000 |
34 |
-0.005144 |
0.000000 |
0.0 |
0.333333 |
0.529412 |
18.000000 |
True |
15.8 |
41.6 |
18.53 |
0.0 |
0.0 |
0.0 |
NaN |
NaN |
NaN |
NaN |
NaN |
NaN |
| 2025-11-23 10:01:04+08:00 |
48 |
601 |
Ws_E14 |
1.486059 |
30 |
601.07 |
601.250000 |
601.64 |
602.333333 |
17880.0 |
17980.000000 |
34 |
0.000000 |
0.000000 |
0.0 |
0.333333 |
0.588235 |
20.000000 |
True |
10.8 |
41.6 |
20.00 |
0.0 |
0.0 |
0.0 |
NaN |
NaN |
NaN |
NaN |
NaN |
NaN |
| 2025-11-23 11:01:04+08:00 |
48 |
661 |
Ws_E14 |
1.486059 |
30 |
661.07 |
661.250000 |
661.64 |
662.333333 |
17980.0 |
18068.333333 |
34 |
0.000000 |
-0.074074 |
0.0 |
0.300000 |
0.519608 |
17.666667 |
True |
10.8 |
41.6 |
18.53 |
0.0 |
0.0 |
0.0 |
175.0 |
46.0 |
-0.385185 |
NaN |
NaN |
NaN |
| 2025-11-23 14:40:00+08:00 |
48 |
880 |
Ws_E14 |
1.486059 |
30 |
880.00 |
880.250000 |
880.57 |
881.333333 |
18030.0 |
18130.000000 |
34 |
0.000000 |
0.000000 |
0.0 |
0.333333 |
0.588235 |
20.000000 |
True |
15.0 |
45.8 |
20.00 |
0.0 |
0.0 |
0.0 |
NaN |
NaN |
NaN |
NaN |
NaN |
NaN |